

Economic indicators in India are easier to use responsibly when you can trace each observation to its producer, dated release and underlying table. A search result or calendar entry is a starting point, not a complete source record. This guide shows how to build that record without confusing a release date, reference period or revised estimate.
By CrowdSent Blog Team. Sources checked on 28 October 2026. Educational information, not investment advice. The dated example below is a source-reading exercise, not a live economic-data feed.
The quick answer: keep the source chain intact
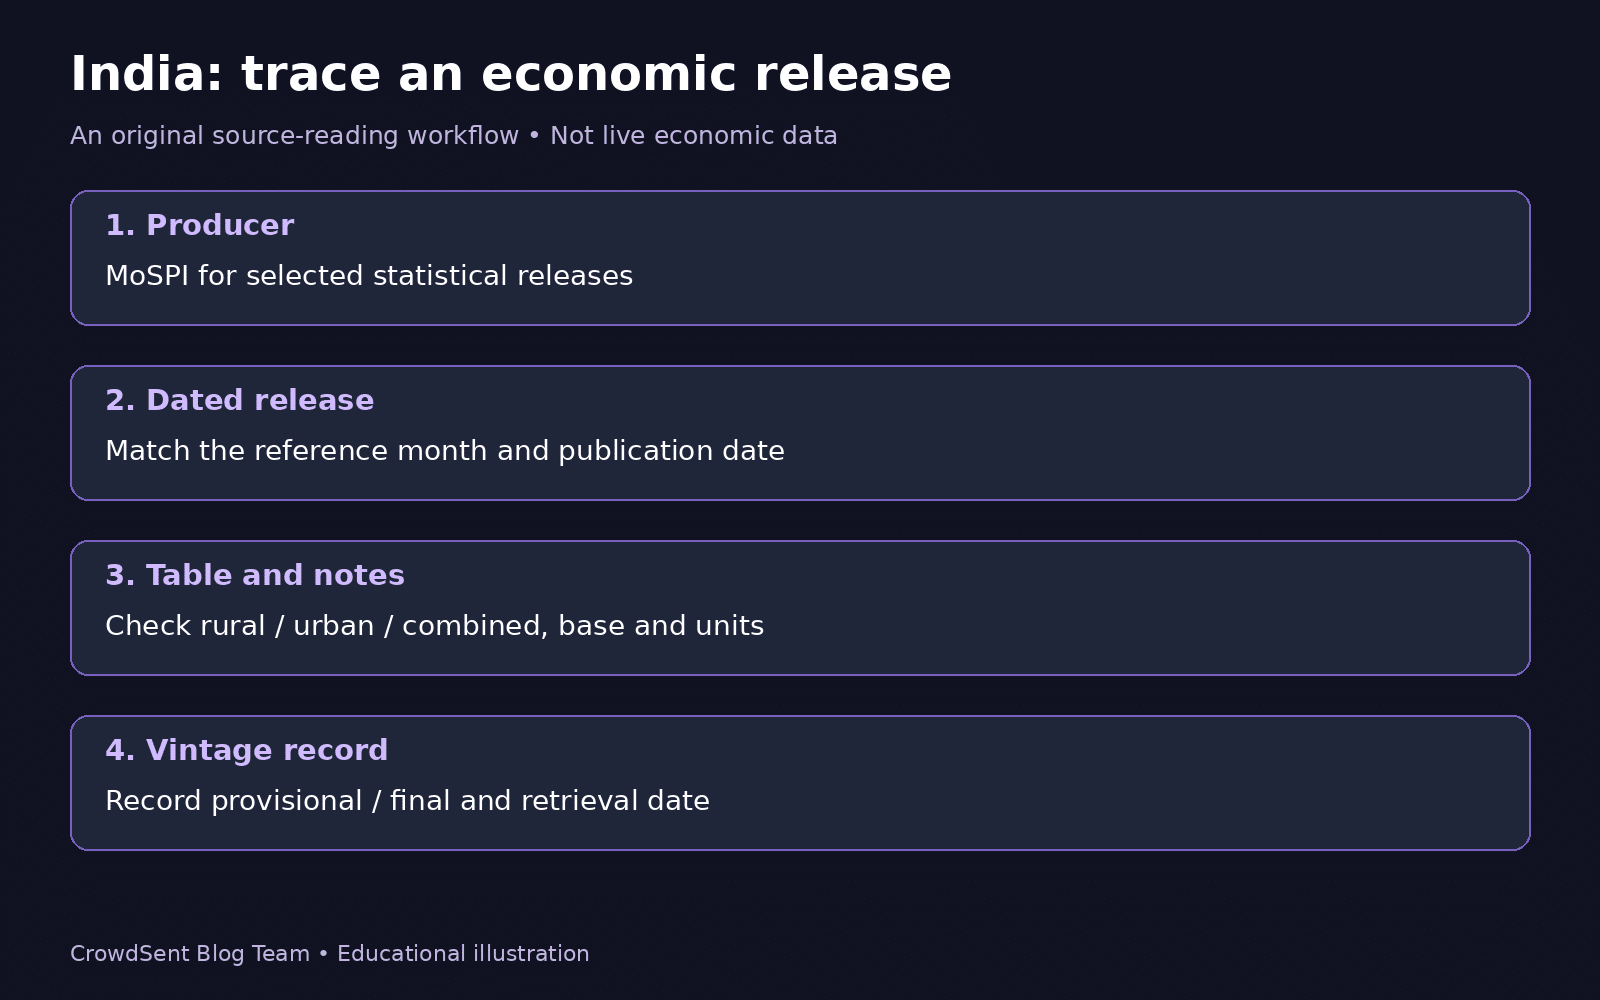
For each statistic, save five things together: the responsible producer, the dated announcement, the exact table or series, its definitions and the version you used. That small habit makes it possible to explain a number later, compare it fairly and spot a revision without silently rewriting your research.
Start with a narrow question such as “Which release contains the combined consumer-price index for a particular month?” rather than “How is India doing?” The narrow question gives you a series to identify. The broad question requires several measures and interpretation; one headline cannot settle it.
Where to find economic indicators in India
The Ministry of Statistics and Programme Implementation, or MoSPI, publishes an advance release calendar covering families such as gross domestic product, industrial production, consumer prices and the Periodic Labour Force Survey. Its 2026–27 calendar edition dated 25 May 2026 is a useful map of those publication families, rather than a substitute for their individual releases.
A MoSPI announcement can also be published through the Press Information Bureau, or PIB. Check the issuing ministry printed on the announcement: the website carrying a document and the organisation producing its statistics are different parts of the source record. For monetary-policy decisions and meeting records, use the separate guide to RBI MPC resolutions and minutes, instead of treating a statistical calendar as a complete policy archive.
Build a bookmark for the publication family you actually use. A general homepage can move an older item out of view; a dated release is more precise. Keep both a route back to the producer and a link to the document supporting your note. If a page fails to load, record the access limitation instead of concluding that the statistical release does not exist.
A scheduled release is not a published observation
A calendar tells you when to look. The release tells you what became available. MoSPI’s calendar includes a note that dates can change and that holidays can shift publication to the next working day. Do not convert an expected date into a claim that a report has already appeared.
Our suggested research routine is simple: write the planned date in a “schedule” field, then leave the “publication verified” field empty until you open the announcement. If the document is not available, say so. Do not fill that gap with a forecast from a third-party calendar and label it official data.
When reading a third-party calendar alongside the primary source, keep its consensus estimate separate from the official observation. The distinction between actual, forecast and previous calendar values deserves its own check. A previous figure displayed today may not be the version displayed before an earlier announcement.
Record the period, publication date and vintage separately
Use three separate fields in your notes. The reference period identifies what the statistic describes. The publication date identifies when the document was issued. The vintage identifies the release version or estimate status you used. Adding your own access date answers a fourth question: when did you inspect that source?
This separation is useful when reviewing an older argument. A note written before a revision should be evaluated against information available at that time, not quietly compared with a later replacement. For a historical comparison, preserve the original source record and add the newer version alongside it.
Also copy the complete period label. If a table says a quarter belongs to a particular financial year, do not shorten it to a calendar-quarter label without checking its month range. Similarly, do not turn a monthly figure into an annual estimate merely because both appear in the same document.
A dated CPI example: identify the column before the number
The MoSPI CPI announcement published by PIB on 12 October 2026 covers September 2026 and names the index base as 2024=100. Its national-level table labels August as final and September as provisional, and separates rural, urban and combined columns. This is a dated example, not a claim about the latest available release when you read this page.
Before copying a cell, point to its row and column labels. The document includes both index levels and inflation rates, so a copied number without its measure is incomplete. Its annexures provide more detailed tables. Use the document’s own labels rather than substituting a headline description.
An original research note could read: “I inspected the 12 October announcement, selected the September combined CPI series, and retained its provisional label and stated base.” This describes the evidence used without making a market prediction or reproducing a table of values.
Now test your note: could someone else locate the same observation without asking you which column you meant? If not, add the missing table title, row, unit or period. Precision here is more useful than adding another unsupported interpretation.
Eight source checks for economic indicators in India
The following is an original checklist for your own research, not an official reporting form. Keep one record per series and release. It can be a simple text document; a complicated dashboard is not required.
- Question: What exact observation am I trying to locate?
- Producer and publication: Which organisation issued it, and what is the dated document title?
- Locator: Which URL, annexure, table, row and column identify it?
- Period: Which month, quarter or financial year does it describe?
- Measure: Is it a level, rate, index or another quantity, and what unit is shown?
- Series definition: What coverage, base, adjustment or other qualifiers does the document specify?
- Status: Which provisional, revised or final label accompanies this observation?
- Research date: When did I access it, and what remains unverified?
Use “not checked” when a definition is missing from your review. That is more honest than copying a familiar definition from a different series. If you later find the relevant methodological note, update the record and keep a short explanation of the change.
Make comparisons only after matching definitions
Before placing two observations side by side, compare their labels as carefully as their values. Ask whether they use the same geography, population coverage, reference period, units, series base and estimate status. If one of those differs, explain the difference or stop the direct comparison.
A practical safeguard is to write a comparison sentence before creating a chart: “These observations describe the same measure for these periods, using these definitions.” If you cannot complete that sentence, the chart is not ready. Keep any unresolved limitation visible in your working note.
For conceptual background, read CPI versus core CPI, nominal versus real GDP and leading, coincident and lagging indicators. This source guide does not replace those explanations or rank indicators as trading signals.
Frequently asked questions
1. Where should I start for official economic indicators in India?
Start by naming the statistic and its producer. For the MoSPI publication families discussed here, use the calendar to locate the release, then retain the actual dated document and table. Avoid treating a search-result snippet as your final reference.
2. How does a release calendar differ from an actual release?
A calendar is a schedule. A release is the evidence that the information was published. In your notes, record these as separate steps; an expected date alone does not verify either publication or the value of an observation.
3. What is the difference between the reference month and release date?
The reference month describes the period being measured; the release date belongs to the announcement. Record both explicitly rather than calling a figure “October data” simply because you found it in October.
4. How do I identify a provisional or final observation?
Read the relevant table heading, notes and column labels. Keep the status attached to the exact period you copied. Do not apply one column’s label to every observation in the document.
5. Why should I record the base year?
It is part of the series identification. Before comparing figures from different documents, check their stated bases and methodology. Do not assume that matching indicator names make observations directly comparable.
6. How should I handle rural, urban and combined CPI labels?
Select the coverage that answers your question and copy that label with the observation. A combined column should not be casually relabelled rural or urban. If you need to explain construction or weights, consult the series methodology rather than inventing an averaging rule.
7. Where do I find the table behind a headline?
Look for the announcement’s annexures, downloads and references to the producer’s data resources. Record the exact table and cell location. If you only have the headline, make that evidence limitation explicit.
8. How do I avoid mixing financial-year and calendar-quarter labels?
Preserve the source’s complete period label and verify its month range before converting it. Use that verified range consistently in notes and charts, especially when comparing documents that use different period conventions.
9. Where should I look for monetary-policy documents?
Treat policy records as a separate source trail. Our linked RBI MPC guide distinguishes the document types. Do not assume that an economic-statistics release includes the decision, reasoning and meeting record you need.
10. Does an official source provide a trading signal or a CrowdSent data feed?
No. This article explains how to document sources. It does not recommend a trade, promise an outcome or establish that any listed series is available inside CrowdSent. Check current product information separately from this educational guide.
Build a clearer research record
Keep the source chain, definitions and uncertainties together before interpreting economic indicators in India. If you want to explore CrowdSent, review the current membership options and decide whether the documented offering fits your needs. Trading and investing involve risk; this guide is not personal financial advice.