

Nominal vs real GDP separates two reasons an economy’s measured value can rise: more output and higher prices. Nominal GDP uses prices from the period being measured. Real GDP adjusts for price changes so that the growth comparison focuses on the volume of output.
That distinction becomes especially important when a headline gives a large currency amount next to a much smaller growth rate. Both can be correct. One may describe current-dollar size, while the other describes inflation-adjusted growth, potentially at an annualized quarterly rate.
This guide uses the United States as its statistical reference. Every numerical example is hypothetical. The same reading questions are useful in India and Pakistan, but the methods, reporting conventions and fiscal-year labels must be checked in the relevant local release.
1. Nominal vs real GDP: choose the right measure
GDP summarizes production within an economy over a stated period. Nominal GDP, also called current-dollar GDP in US releases, values that production at the period’s prices. Real GDP removes the effect of price changes when measuring changes in output. The BEA primer on GDP and the national accounts provides the underlying national-accounting framework.
If the question is “How large was production in money terms?”, a nominal measure can be appropriate. If the question is “Did the volume of production grow?”, a real growth measure is usually the relevant starting point.
Write your question above your calculation. This small step prevents a misleading substitution later. A larger money total does not by itself show a larger quantity of goods and services, and a real growth rate does not tell you the exact number of current dollars spent.
Neither measure describes every household’s experience. An aggregate production measure does not, on its own, show distribution, affordability or changes in unpaid activities. Keep the conclusion proportional to the question the statistic can answer.
2. Rebuild the difference in a one-product economy
Imagine an economy producing only one final good. This deliberately simplified model makes the arithmetic visible; it is not a reproduction of the method used for modern US national accounts.
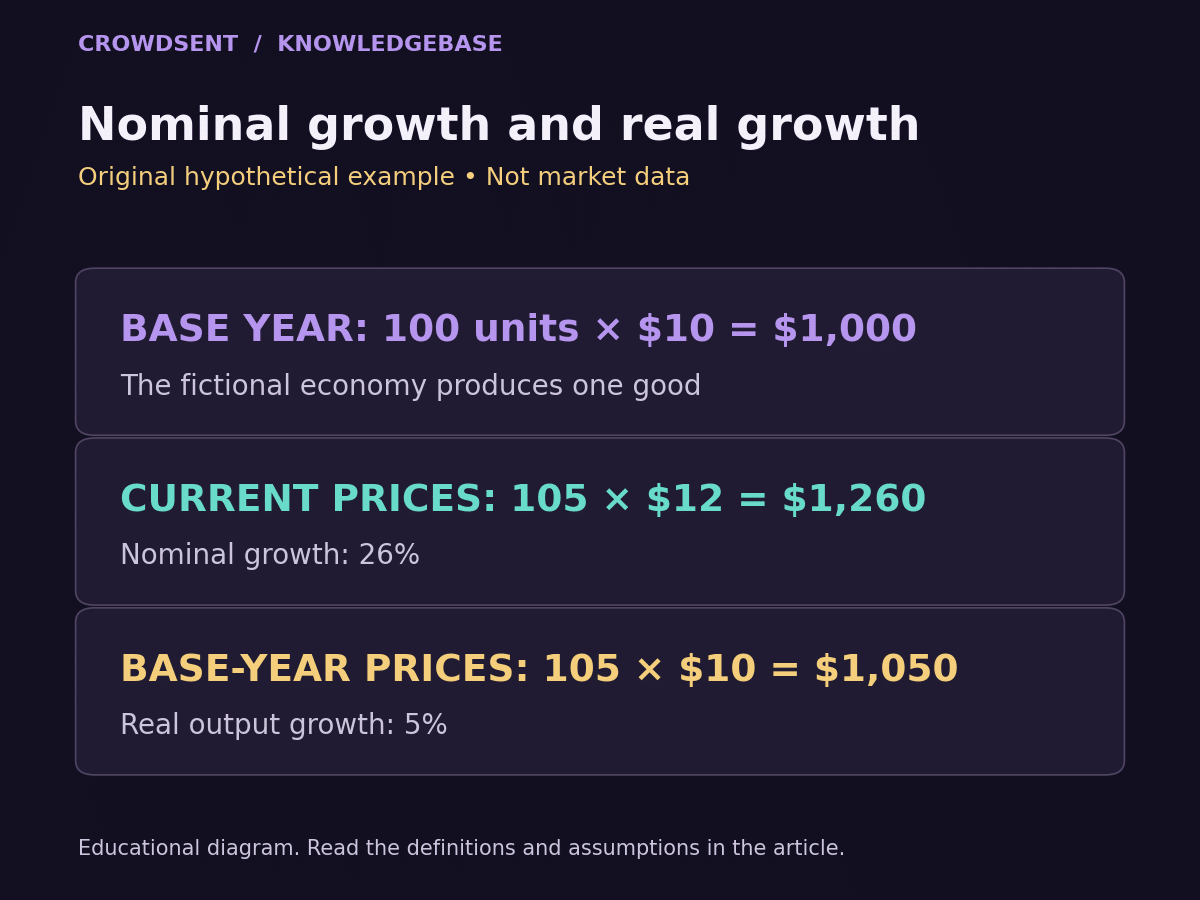
In Period A, it produces 100 units, each priced at $10. Nominal output is 100 × $10 = $1,000. Use Period A’s price to create the example’s constant-price comparison.
In Period B, it produces 105 units, each priced at $12. Nominal output becomes 105 × $12 = $1,260. That is an increase of $260, or 26%.
To isolate the change in quantity, value Period B’s 105 units at the original $10 price. The result is $1,050. Compared with Period A’s $1,000, real output increased by $50, or 5%.
- Quantity increased from 100 to 105 units: 5%
- Price increased from $10 to $12: 20%
- Nominal value increased from $1,000 to $1,260: 26%
- Constant-price value increased from $1,000 to $1,050: 5%
Why does 5% plus 20% not equal the nominal increase? Because the higher price applies to all 105 units, including the five additional units. The effects multiply: 1.05 × 1.20 = 1.26.
This example also shows how nominal GDP could grow while real output falls. In a separate hypothetical case, quantity falls from 100 to 98 units while price rises from $10 to $11. Nominal output rises to $1,078, a 7.8% increase, although real output at the original price falls to $980, a 2% decline.
The two cases answer the same practical question: how much of a money-value change came from quantities? You do not need a market forecast to establish that distinction.
3. Understand what a price adjustment is doing
For the one-product example, a price index with Period A equal to 100 would be 120 in Period B. Dividing $1,260 by 1.20 recovers the constant-price value of $1,050.
When using a compatible GDP implicit price deflator indexed to 100, the relationship can be written as real GDP = nominal GDP ÷ (deflator ÷ 100). The series must share the same scope, period and reference convention. It is not permission to divide any GDP figure by any inflation number.
The exact growth relationship in a consistent decomposition is also multiplicative. The real growth factor equals the nominal growth factor divided by the price-growth factor. Subtract one from the result to obtain the real growth rate. In our example, 1.26 ÷ 1.20 − 1 = 5%.
Subtracting 20% from 26% would produce 6%, an approximation that is visibly inaccurate here. Subtraction can be a rough shortcut when changes are small; it should not replace the compatible series or the exact calculation in a worked explanation.
A consumer-price measure and a GDP price measure cover different baskets and concepts. If a post claims to have “removed inflation” by subtracting a familiar consumer inflation headline from nominal GDP growth, ask why that price series is appropriate before accepting the result.
4. Treat chained dollars as a measurement convention
Actual economies produce many goods and services, and their relative prices and composition change. BEA uses chain-type quantity measures rather than simply holding every price permanently fixed at one old year. The BEA definition of chained-dollar estimates explains how to interpret real GDP and why detailed chained-dollar components generally cannot be added to reproduce the aggregate.
For a reader, the important habit is to use the published real aggregate for the aggregate question. To describe contributions to real growth, use the official contribution measures instead of building a total from incompatible chained-dollar pieces.
Imagine a worksheet with separate real series for categories A, B and C. Adding their displayed dollar values may feel natural, especially because the cells have the same currency symbol. The label “chained dollars” is the signal to check the methodology before summing. A familiar-looking unit does not guarantee ordinary additivity.
Reference-year dollars also differ from current dollars. If a real series is expressed in a stated year’s dollars, that label is part of the unit. Removing it from a chart makes the level easier to misread as a current cash amount.
The single-good example above is useful for intuition. Keep its simplification visible rather than presenting it as the full production process behind an official release.
5. Separate levels from growth rates
A level describes the size of the measure in a period. A growth rate describes its change relative to another period. “Real output is 105” and “real output grew 5%” describe related but different things if the comparison level is 100.
Growth also needs a denominator in time. These comparisons can all produce different answers:
- Quarter over quarter: this quarter versus the immediately preceding quarter
- Year over year: this quarter versus the same quarter one year earlier
- Annual growth: the relevant full-year measure versus the preceding full-year measure
Suppose a hypothetical quarterly index follows the path 100, 102, 101 and 103. The last quarter is about 1.98% above the previous quarter. It is not automatically 3% year over year, because the first observation in this four-point sequence is only three quarters earlier.
That small counting error is common when a chart displays four observations and the reader assumes it covers four changes. A year-over-year quarterly calculation needs the observation four quarters earlier, meaning five quarterly points if you show both endpoints and every intervening quarter.
Write the comparison period into your note. “Growth accelerated” is much more useful when it specifies which growth rate accelerated and relative to what.
6. Annualize quarterly growth only when the label calls for it
US GDP coverage often reports a seasonally adjusted quarter-to-quarter change at an annual rate. The BEA explanation of annualized quarterly growth explains that this compounds one quarter’s growth over four quarters. It describes the pace implied by that quarter; it is not a forecast that the next three quarters will match it.
If a hypothetical real-output index rises from 100 to 101, the quarterly increase is 1%. Its annualized rate is calculated as (1.01 raised to the fourth power − 1) × 100, which is about 4.06%.
You can report this as “1% from the previous quarter, equivalent to about 4.06% at an annualized pace.” You should not write “the economy produced 4.06% more in that quarter” or imply that a full year of observed growth has already occurred.
Simply multiplying the quarterly rate by four gives 4%. That is an approximation, while compounding gives the exact result for this example. The gap becomes larger when quarterly movements are large.
An annualized level is a different convention from an annualized growth rate. A quarterly output flow expressed at a seasonally adjusted annual rate scales the quarterly flow to an annual pace. The growth rate compares periods and compounds their ratio. Do not apply the growth formula to a level just because both labels contain “annual.”
For a cross-country comparison, first translate the reporting conventions into a common basis. A US annualized quarterly growth headline and an unannualized quarterly figure elsewhere should not sit side by side as if their units matched.
7. Record the release version before drawing a trend
The BEA GDP release notes describe advance, second and third estimates, followed by later updates. New source information can change the estimate of a quarter that has already ended. A revised figure refers to the earlier period; it is not fresh growth occurring on the publication day.
Picture two saved headlines: “quarterly growth 2.0%” and, several weeks later, “growth 2.3%.” Those numbers might be different estimates of the same quarter, rather than successive quarters. Without the reference period and estimate label, a chart could accidentally create a false acceleration.
A concise GDP research record should include the country, reference period, release date, estimate version, nominal or real basis, unit, seasonal adjustment and growth convention. Then add your interpretation separately.
The guide to verifying market news covers source checks, while the guide to historical comparisons is useful when comparing observations across time. Use the market research journal template to preserve the labels with the figures rather than reconstructing them later from memory.
Frequently asked questions
Which is higher, nominal or real GDP?
There is no universal ordering. The relationship depends partly on the price reference convention. In the first worked example, Period B nominal output is higher because its price is above the chosen reference price. The absolute gap is not a stand-alone measure of economic success.
Can nominal GDP rise while real GDP falls?
Yes. Our second scenario combines a 2% quantity decline with a 10% price increase. The resulting nominal value rises 7.8%. Keeping prices and quantities separate explains how both statements can be true.
Is real GDP calculated by subtracting inflation?
That is an approximation for some growth comparisons, not a complete level calculation. In the worked example, the exact factor calculation gives 5% real growth; simple subtraction gives 6%. Use compatible measures and the stated methodology.
Is the GDP deflator the same as consumer inflation?
No. The coverage differs. A price adjustment should match the output measure being analyzed. Naming a familiar inflation index is not enough to show that it is the correct deflator for a particular GDP calculation.
Does real GDP measure purchasing power for every household?
No. It is an aggregate production measure. A household’s income, expenses and circumstances require additional evidence. Avoid turning an economy-wide real growth number into a claim that every person’s living standard changed by that percentage.
Why should I keep the reference year on a real GDP chart?
It identifies the unit convention behind the displayed levels. Readers can compare growth more clearly when they know whether the chart shows current money values, a quantity index or values expressed in reference-year dollars.
Can I add chained-dollar components together?
Generally, that will not reproduce the published total. Use the official aggregate and contribution tables for those purposes. A spreadsheet sum can be arithmetically correct while answering the economic question incorrectly.
Is annualized quarterly growth a forecast?
No. It expresses one quarter’s observed estimated pace as a compounded annual pace. It does not establish what later quarters will do or what the eventual full-year result will be.
Is year-over-year growth the same as annualized growth?
No. Year-over-year quarterly growth compares two observed quarterly estimates four quarters apart. Annualized quarter-over-quarter growth compounds the latest single-quarter change. Their time denominators are different, even when the resulting percentages happen to match.
How should I compare US GDP with India or Pakistan?
Align real or nominal basis, time period, currency or index units, seasonal adjustment and annualization first. Also check calendar-year versus fiscal-year coverage. If those cannot be aligned, show the differences clearly instead of presenting a like-for-like ranking.
A careful GDP reading starts with four labels: price basis, level or change, comparison period and release version.