

On an economic calendar, actual usually means the newly released figure, forecast refers to a pre-release expectation, and previous gives an earlier comparable observation. Reading those three columns accurately also requires the indicator’s units, reference period, source, and revision status.
A number above forecast is simply above that particular forecast. Whether it describes a stronger economy, faster inflation, or an unfavourable development depends on what is being measured. A coloured cell cannot supply that context.
This guide builds a practical way to read economic calendar actual, forecast and previous values, using hypothetical examples rather than current releases or trading recommendations.
What do economic calendar columns mean?
Actual is the value reported for the event and measurement shown. It can be an estimate published by a statistical agency, a survey result, or an announced policy setting. The label means the value has been released; it does not guarantee that the value will never change.
Forecast is an expectation recorded before publication. Some calendars use the word for a consensus collected from economists. Others separately show a consensus and a forecast produced by the provider’s analysts or model. Read the provider’s explanation before treating the labels as interchangeable.
Previous commonly refers to the earlier period used for comparison. It may show a revised value rather than the number first announced. For staged releases, such as successive estimates of the same quarter’s GDP, inspect the row description carefully to identify what the provider is comparing.
For a concrete provider example, the Trading Economics calendar explanation describes its consensus as an average of economists’ forecasts and distinguishes it from its own forecast. It also identifies revised previous values. That documentation describes its service; another calendar’s definitions should be checked separately.
Before doing arithmetic, finish one sentence: “This row measures [indicator], for [reference period], in [units], using [adjustment and release stage].” If part of that sentence is missing, the three numbers are not yet ready for comparison.
Where does the consensus forecast come from?
A consensus summarises expectations from a defined group. It is not an official promise about the upcoming result. Record who collected it and, where available, whether it uses an average or a median, how many estimates were included, and when the collection closed.
These details matter even when the headline number looks simple. Five forecasters could submit identical estimates, or they could disagree substantially while producing the same average. A single consensus value does not tell you which situation occurred.
If two calendars display different forecasts, check their collection times and methods before concluding that either is wrong. One may have included updated submissions that the other had not yet incorporated. Where the methodology is unavailable, describe the forecast as that provider’s displayed expectation and keep the limitation visible.
For a later review, preserve the forecast visible before the release. A number retrieved after the event may have a different update history. It cannot automatically establish what a reader knew beforehand.
Read the indicator’s units before the surprise
A compact calendar often shortens important labels. “MoM” means month over month; “YoY” means year over year; “QoQ” means quarter over quarter. A percentage-point difference and a percent change are different calculations.
Suppose a hypothetical rate is 4.2% against a 4.0% forecast. The difference is 0.2 percentage points, or 20 basis points. Calling that a 0.2% relative increase would describe a different calculation: the relative difference is 0.2 divided by 4.0, which equals 5%.
A count is different again. If an employment measure is reported in thousands, 180K represents 180,000 in the stated unit. Do not subtract 180 from a forecast written as 170,000 without first aligning the scale.
Also check whether the series is seasonally adjusted, and whether a growth rate is annualised. BEA explains these conventions and the stages of GDP publication in its GDP release reference. A quarterly annualised growth rate should not be treated as a year-over-year rate simply because both carry a percent sign.
Retain the full indicator name in your notes. “Inflation” alone is usually less useful than the precise index, coverage, period, and comparison shown in the source.
A worked example with a revision
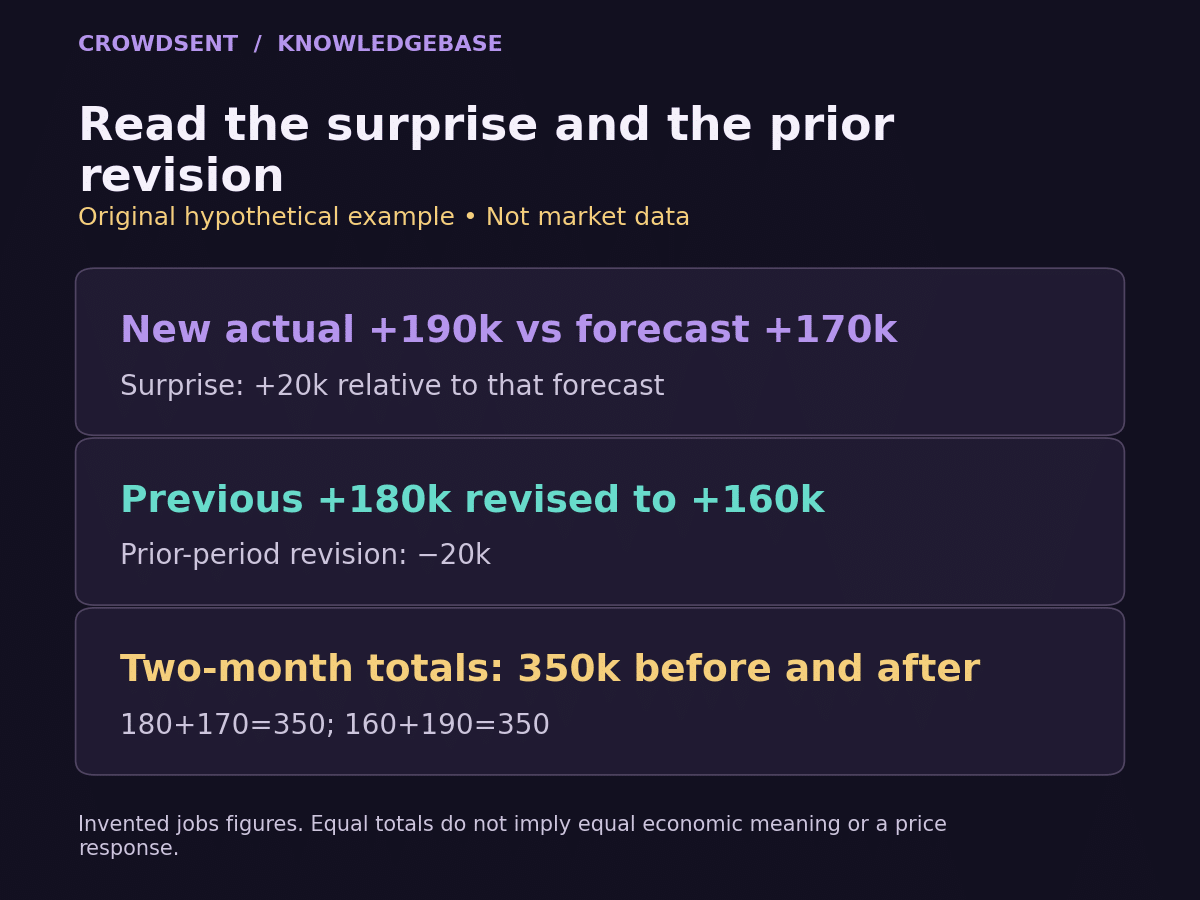
Consider a completely hypothetical monthly employment-change release. The numbers below are invented solely to illustrate the reading process:
- Forecast before publication: an increase of 170,000 jobs
- New actual: an increase of 190,000 jobs
- Previous month’s first estimate: an increase of 180,000 jobs
- Previous month after revision: an increase of 160,000 jobs
The new actual exceeds the forecast by 20,000. That is the comparison between the latest release and the chosen expectation.
The previous estimate has been revised down by 20,000. That is a separate comparison between two versions of the same earlier month. The new month’s increase is also 30,000 larger than the revised previous month’s increase.
All three statements can be true. They answer three different questions: how the release compared with expectations, how earlier information changed, and how two months compare using the revised baseline.
There is a useful combined check. Before publication, the first previous estimate plus the new forecast totals 350,000. After publication, the revised previous estimate plus the new actual also totals 350,000. In this simplified example, the two-month total matches that particular pre-release baseline despite the new headline exceeding forecast.
This equality is just arithmetic under the stated assumptions. It says nothing about how prices must react. It also does not cover revisions to additional months or information in other parts of the release.
A careful summary would preserve all four inputs. Writing only “the figure beat expectations” would omit the earlier revision; writing only “the revision cancelled the beat” would hide the distinct comparisons. Keep the numbers attached to their periods and versions.
Why previous values can change
Statistical releases balance timely publication with information that becomes available later. For the US establishment employment survey, BLS explains that preliminary estimates are revised in each of the following two months as additional responses arrive. The series also has a separate benchmarking process. See the BLS technical notes on revisions.
A revision therefore requires a version label. “Previous: 160,000” is incomplete for historical analysis if the number initially available was 180,000. Save both when your question concerns what people could have known at the time.
Different research questions require different records. To describe the latest statistical picture, use the latest comparable data and record when you retrieved it. To reconstruct a release-day information set, preserve the original publication and the forecast available before it.
For GDP, advance, second, and third estimates concern successive versions of a quarter’s measurement. They should not be stacked as three separate quarters. The third estimate can still be affected by later updates, so “third” is a release-stage label rather than a promise of permanent finality.
Separate reference period, release time and update time
Every calendar event can involve several clocks. The reference period says when the measured activity occurred. The release timestamp says when the result was published. The provider update timestamp, if available, says when that service refreshed its record.
Imagine that a February activity measure is published during March. A chart annotation belongs at the March release time if your question concerns when the information became public. Labelling the announcement as a February event solely because the data describe February can misalign the research.
The official Employment Situation release schedule separates reference months from release dates and times. Check the named timezone and the specific event date when converting a US release into your local time.
For readers in India and Pakistan, a reliable approach is to retain the original US timestamp and add a date-aware conversion for Asia/Kolkata or Asia/Karachi. Avoid using a remembered hour difference across the whole year: US daylight-saving changes can alter the local conversion.
A late-updating calendar and an official publication can have different timestamps without representing different economic events. Record the distinction rather than assuming the delay identifies another announcement.
What a surprise can and cannot establish
The simplest numerical surprise is actual minus forecast, with matching units. A positive result establishes that the release exceeded that forecast. It does not, by itself, classify the news as favourable or determine an asset’s direction.
For one indicator, a higher number may describe more activity. For another, it may describe a larger cost or more unemployment. A release may also contain several measures with different implications. Read the definition and the broader document before applying a directional label.
Even comparisons between surprise sizes need care. A difference of 0.2 percentage points in one series is not automatically comparable with the same difference in another. Normal variability, rounding, measurement precision, and the distribution of forecasts can differ.
When documenting a market move around a release, separate sequence from explanation. “The price changed after the publication” records timing. Claiming that one number caused the entire move needs additional evidence, especially when several announcements occurred together.
A release note you can reproduce later
Use a compact record that keeps definitions and evidence together:
- Identity: country, publisher, full indicator name, reference period, and release stage
- Measurement: unit, comparison basis, and seasonal or annualised treatment
- Timing: scheduled and observed publication timestamps, timezone, and retrieval time
- Values: actual, forecast with its source, previous first estimate, and revised previous value
- Evidence: original release link, relevant footnotes, and a separate interpretation
If a field is blank, leave it missing until verified. A blank forecast does not mean economists expected zero. A blank actual may reflect a pending release or unavailable data. Our guide to missing market data versus zero explains that distinction.
When a screenshot or social post is your starting point, follow the steps in how to verify market news to locate the original evidence. Then save the complete reading in a market research journal, including any unresolved ambiguity.
Frequently asked questions
1. What does actual mean on an economic calendar?
It is the newly reported value for the specified event and measurement. For statistical releases, it can be a preliminary estimate. Check the release stage and revision policy before treating it as a permanent historical value.
2. Is forecast always the consensus?
No. Providers can distinguish economists’ consensus from a separate in-house or model forecast. Read the column definitions and identify the expectation you are using before calculating a surprise.
3. Why is previous different from last month’s headline?
The earlier period may have been revised, or the calendar may be displaying a different series or release stage. Compare the official publications and the row’s full label before deciding which explanation applies.
4. Does actual above forecast always mean good news?
No. The meaning depends on the indicator and the question being asked. A larger number can represent increased activity, higher costs, or more unemployment. The arithmetic sign alone supplies no universal judgement.
5. How do I calculate an economic-data surprise?
Subtract the matched forecast from the actual. Retain the unit: jobs, currency amounts, index points, or percentage points. Document the forecast’s provider and collection time where available.
6. Why can two calendars have different forecasts?
They may use different contributors, calculation methods, or submission cutoffs. They may also label a provider forecast differently from a survey consensus. Check those details instead of averaging the two displays without explanation.
7. Does an empty actual cell mean zero?
No. Empty can mean the result is pending, missing, or unavailable in that feed. Zero is a reported numerical value. Confirm the publication status before filling the gap.
8. Are month-over-month and year-over-year figures comparable?
They describe different comparison periods. You can discuss both with clear labels, but they cannot be substituted for each other in an actual-versus-forecast calculation. Match the exact measurement first.
9. How should I record a US release in India or Pakistan?
Keep the original date, time, and timezone, then add a date-aware local conversion. Include the reference period separately. This preserves when the announcement happened and which period its data describe.
10. Should historical research use the original or revised value?
Use the version that answers the question. Release-day analysis needs the information available then; analysis of the latest economic history can use revised data. Label the version and retrieval date so readers can reproduce the choice.
Read the row, then read the release
The calendar is a useful starting summary. A dependable interpretation keeps each number’s source, period, unit, timing, and version intact. Those details make an apparent surprise understandable and a later comparison reproducible.
This article is educational and does not provide investment or trading advice. All worked-example figures are hypothetical.