

CrowdSent Blog Team · Market research education
Missing market data vs zero is a distinction that can change the meaning of an entire research note. A confirmed zero says that a defined measurement produced zero. A missing value says the required observation is unavailable. A stale number describes an earlier observation, and a loading state describes an unfinished display process.
This guide provides eight checks for deciding what a dashboard field actually supports. You do not need to write software to apply them. Start with the field label, source, time and coverage, then preserve uncertainty before you calculate, compare or quote the result.
The examples are fictional and product-independent. They do not describe the current interface or data coverage of CrowdSent or any other dashboard. For researchers in India and Pakistan, the checks apply equally to local-language discussion summaries, international market references and records displayed in different time zones.
1. Define the field before interpreting a zero
Write a plain-language definition of the quantity. Is it a count of posts, a percentage change, an executed-volume total, a sentiment score or an observation age? Record its unit and window. The same character, zero, has different implications for each field.
A zero change can occur when the two compared values are equal at the displayed precision. It does not say either underlying value is zero. A zero count applies to the records counted within the stated coverage. A zero score depends on the scale’s definition. These distinctions follow from the measurement, not from the appearance of the card.
Check whether the display rounds values. A small nonzero quantity can appear as 0.00 when formatted to two decimal places. If more precise source data is available, preserve it separately. If only the rounded display exists, say “displayed as zero at this precision” rather than claiming mathematical exactness.
Also inspect the denominator. A rate or percentage can be undefined when its required denominator is zero or missing. A site may show a dash in that case. Without the field definition, you cannot determine whether the dash means undefined, unavailable or something else.
2. Distinguish missing market data vs zero in the display
Treat the visible state as an observation of the interface, then look for its documented meaning. A dash, an empty card, “N/A,” “null” and a spinner may have different causes. Do not assume they are standardised across providers. “Null” commonly marks an absent value in data formats, but the service’s own definition controls its meaning.
- Verified zero: the source supplies a zero for a defined, observed field.
- Unavailable: the value cannot currently be obtained or was not supplied.
- Outside coverage: this asset, venue, period or language is not included.
- Stale: a value exists, but its observation time is older than the question requires.
- Loading: the interface has not finished presenting a result.
- Undefined: the requested calculation lacks a mathematically valid result under its rules.
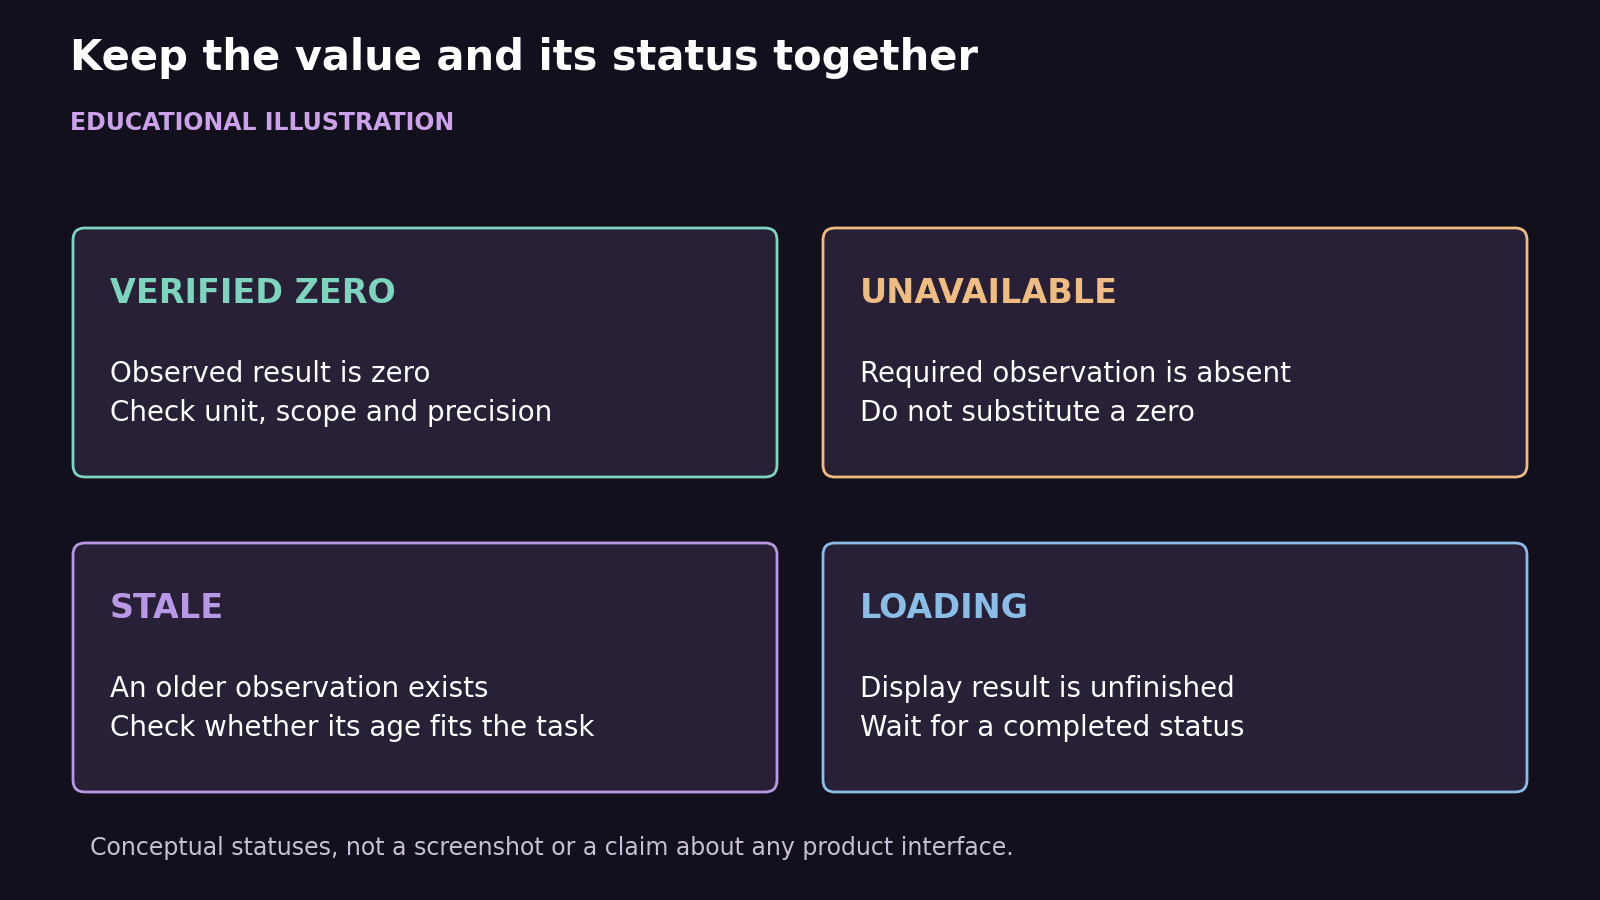
These statuses need not share a remedy. A refresh may complete a loading request but cannot add an unsupported market to a dataset. Waiting may help with a scheduled delayed release but cannot determine a missing denominator. Identifying the state narrows the next useful check.
When the interface does not distinguish them, write exactly what you saw and mark the meaning unresolved. “The field showed a dash at collection time” is more defensible than “activity was zero.” Avoid guessing that a feed outage, market closure or quiet audience caused it.
3. Separate market data freshness from page freshness
A successful page load tells you that some interface content arrived. It does not establish when each underlying observation was produced. A dashboard can combine fields with different schedules, delays and sources. Inspect timestamps at the level of the field you plan to use.
Keep three times if they are available: when the underlying event or observation occurred, when the provider published or refreshed it, and when you collected it. If the label merely says “updated,” seek its definition before deciding which time it represents.
Hypothetical timing example: you open a page at 10:15 UTC. One field is labelled with an observation time of 10:00 UTC; another shows yesterday’s date; a third has no timestamp. For a question about the latest fifteen minutes, the first may be relevant subject to its coverage, the second describes older conditions, and the third has unverified freshness.
Staleness is relative to the research task. A monthly statistic can be entirely appropriate for a monthly question while being unsuitable for explaining a minute-by-minute event. Define an acceptable observation window in advance rather than rejecting every slower series or accepting any number that looks recent.
Retain time-zone labels when comparing timestamps. Use unambiguous date formats and, where helpful, a parallel local-time column. A date crossing at midnight UTC can produce different local-day groupings in India and Pakistan without indicating any problem in the source.
4. Check what the source actually covers
A field can be complete within its stated coverage while leaving your broader question unanswered. “No matching records from these sources” is narrower than “no activity anywhere.” Keep the source universe alongside the number: assets, pairs, venues, platforms, languages and collection interval.
Check identifiers carefully. Similar symbols can refer to different assets, contract types or quote currencies. A source might include a spot pair but exclude a related derivative, or provide recent history without supporting an older period. Do not copy a neighbouring instrument’s value into the missing field.
For discussion evidence, a silent sample may reflect the selected sources or search terms. The guide to evaluating community discussions helps define which conversations you actually examined. A count from English-language sources should not quietly become a statement about all languages in India or Pakistan.
Hypothetical coverage example: a research sheet requests four venues. Two return complete observations, one returns an explicit unsupported-market status, and one does not respond. You have two observed venues, one known coverage exclusion and one unresolved response. Describing the sheet as four observations with two zeros would misrepresent both gaps.
Preserve exclusions when writing a total. A total of observed sources may still be useful if clearly labelled. It should not acquire the label “market-wide” merely because the available observations were added correctly.
5. Read missing-candle rules at the dataset level
Candlestick datasets provide a concrete reason to consult source documentation. Coinbase’s product-candles documentation warns that historical data can be incomplete and says it does not publish intervals with no ticks. A gap therefore requires checking both the dataset’s construction and whether the requested history was completely retrieved.
Kraken’s downloadable OHLCVT explanation says its files contain intervals in which trades occurred. Within that documented dataset convention, absent candles represent no trades for those intervals. This statement concerns that dataset; it does not establish the meaning of every empty space in an unrelated chart.
The important distinction is between a documented omission rule and an unverified delivery gap. If a complete file intentionally omits no-trade intervals, its omission can carry defined information. If a download is truncated, a request uses the wrong date range or a page fails to render, the resulting visual gap has a different evidential status.
Check the interval boundaries, requested range, returned range and any retrieval limits before interpreting an absent candle. A chart might also connect across gaps or fill empty intervals for display. Preserve the underlying record and the display treatment separately.
Even where no trades occurred, that does not create an observed transaction price of zero. Price fields and trade counts answer different questions. A flat carry-forward line, if used for presentation, should not be mistaken for newly observed trades at the repeated level.
6. Protect calculations from silent gap-filling
Before calculating a change, verify both endpoints. Before calculating an average, identify which observations exist. Before calculating a ratio, verify the numerator and denominator together. Spreadsheet defaults and charting choices can conceal these checks, so inspect the actual input rows.
Hypothetical average: a four-interval study has observed counts of 8, 0 and 16, with the fourth interval unavailable. The mean across the three observed intervals is 24 ÷ 3 = 8. Replacing the unavailable interval with zero gives 24 ÷ 4 = 6. These are different calculations with different denominators.
The first result should be labelled “average across three observed intervals,” with the missing interval disclosed. It is not necessarily an unbiased estimate of the full four-interval period. The second embeds an unsupported no-activity assumption unless independent evidence validates that zero. Neither presentation should hide its coverage.
Carry-forward also changes meaning. Repeating an older value into an empty row can make a chart continuous, but it creates a filled observation under a chosen rule. If that display is useful, mark it visibly and exclude it from claims that require newly observed data unless your research method explicitly justifies its use.
A percentage change from a genuine zero base needs particular care because the ordinary division is undefined. Do not repair the result by inventing a tiny denominator. Describe the movement in original units, or use a separately justified measurement method with its assumptions stated.
7. Work through a complete hypothetical dashboard case
A researcher studies fictional Asset M across three one-hour windows. The task is to compare discussion counts from the same specified English-language source set. The researcher collects the dashboard at 12:10 UTC and saves its field definitions. The interface is fictional and is not a representation of any named product.
- Window one: count 18, completed interval, observation time supplied, source coverage confirmed.
- Window two: count 0, completed interval, explicit successful response and the same confirmed source coverage.
- Window three: dash, with no completed observation time and a loading indicator.
The researcher can report that the observed count fell from 18 to zero between the first two defined windows. That statement remains limited to the selected sources and counting rule. The researcher cannot extend the trend through window three or claim the broader public stopped discussing Asset M.
At 12:20 UTC, the third field returns a count of 7 and marks its interval complete. Add the new record with the later collection time while preserving the earlier screenshot. The initial dash was an unresolved display state at the time of collection. The later result resolves that particular gap; it does not make the initial uncertainty a mistake.
Suppose instead the later message says the source set changed. The value is now available, but direct comparability remains uncertain. Mark the boundary and investigate which sources were added or removed before attributing the full difference to changed discussion activity.
This case illustrates two separate tests: whether a value exists and whether it measures a comparable object. Passing the first does not automatically pass the second. Keep those decisions as separate columns in your notes.
8. Finish with a research-reader checklist
Before copying a figure into a report, answer the following questions. A short unresolved answer is preferable to a confident guess.
- What exactly is being measured, in which unit and interval?
- Does the visible status mean observed, missing, loading, excluded, stale or undefined?
- Is a displayed zero exact, rounded or unsupported by a completed observation?
- Which timestamp describes the underlying measurement?
- Which assets, venues, platforms or languages are included?
- Does the source document intentional omissions or retrieval limits?
- Have calculations preserved missing rows and explicit denominators?
- What evidence would resolve the uncertainty or justify a later correction?
Use a market research journal entry to save the source identifier, collection time, original status and bounded conclusion. When a headline depends on the disputed field, apply the news verification checklist before repeating it. A clear note about unavailable data is a useful research result.
Frequently asked questions about missing market data vs zero
Does a dash always mean the provider has no data?
No universal meaning applies. It might indicate an unsupported field, an undefined calculation, an unfinished request or another documented state. Check the provider’s label or help text. Until the meaning is established, record the visible dash and preserve the uncertainty instead of translating it into a number.
Can a genuine zero still be misleading?
Yes, if its scope is omitted. A verified zero across two selected sources says nothing directly about sources outside that set. Precision also matters when a display rounds small values. State the measurement, coverage, interval and precision before drawing a broader conclusion from the zero.
Does refreshing a page prove that the data is current?
It proves only that the page refreshed successfully. Individual fields may come from older observations or update on different schedules. Check their observation times and any stated delay. A recently collected screenshot can still contain stale or undated values.
Should I replace unavailable values with zero in a spreadsheet?
Only if a documented rule and supporting evidence justify that interpretation. Otherwise keep the value absent and retain its status separately. Any filled version should be clearly labelled as a transformation, with the original rows preserved so another reader can reproduce or challenge the choice.
Is a missing candle evidence that an asset had zero price?
No. A dataset may omit intervals without trades, or a retrieval problem may leave a gap. Neither creates an observed zero transaction price. Consult the specific omission rule and confirm retrieval completeness before interpreting the absence.
What is the difference between delayed and stale data?
Delayed data arrives according to some lag, which may be disclosed and expected. Stale describes whether the observation is too old for your particular question. A delayed series can still be appropriate for historical research. Record the timing rather than assigning a universal freshness label.
Can I use another provider to fill a gap?
You can preserve a separately labelled observation from another source. Before combining it, compare definitions, coverage, units and time windows. A replacement with different construction can change the series. Keep the original gap and the alternative observation distinguishable in the research record.
What should I do if the source has no timestamp?
Record when you collected it, but do not rename that as the observation time. Look for documentation or a matching dated source. If freshness remains unknown, limit the result to what was displayed at collection rather than claiming it describes current market conditions.
Does an unavailable sentiment score mean neutral sentiment?
Neutral requires a defined position or category in the scoring method. An unavailable score supplies no such classification. Keep sentiment value and data status separate, especially if a graphic uses a middle position or grey colour while loading.
How should I correct a note after missing data becomes available?
Add the new observation with its source and collection time, and identify which earlier uncertainty it resolves. Preserve the original note when it accurately described the evidence then available. If definitions or coverage changed too, explain that before comparing the new value with older rows.
Source documentation checked 7 October 2026. Educational research guidance. Hypothetical examples are invented and are not current market observations. This article does not provide investment recommendations.