

By CrowdSent Blog Team
CPI vs core CPI starts with the basket, but good interpretation also requires the right time period and comparison base. These examples explain why slower inflation can still mean higher prices.
CPI vs core CPI: what changes in the basket?
In a US inflation release, headline CPI usually refers to the all-items Consumer Price Index for All Urban Consumers. Core CPI refers to the index excluding food and energy. Both track price change, but they cover different sets of consumer purchases. Neither is a direct measurement of every household’s personal bills.
The Bureau of Labor Statistics CPI guide identifies the all-items and all-items-less-food-and-energy series. Food and energy remain included in headline CPI. Publishing a core measure does not remove those costs from the broader index or imply that they are unimportant to consumers.
The practical comparison is between two views of the same broad topic. Headline includes price changes across the full covered basket. Core provides a view with two categories excluded. The two can move differently because those excluded components can behave differently from the rest of the basket.
Start by writing the full series name, geography, time period, and adjustment basis. “Inflation was 3%” is incomplete unless the reader knows which prices were measured and which dates were compared. This guide uses the US benchmark; another country’s CPI requires its own official definitions and weights.
The index level and the inflation rate are different numbers
An index is a scaled measure. If a hypothetical price index equals 100 in a chosen reference period and later equals 125, the later level is 25% above the reference level. The number 125 is not itself an annual inflation rate, and it is not the price of a shopping basket in dollars.
To calculate inflation over a specified interval, compare two levels from the same series: divide the later index by the earlier index, subtract one, and multiply by 100. The BLS guide to CPI calculations explains the percentage-change arithmetic and the importance of the comparison base.
Suppose an index moves from 200 to 206. The increase is 6 index points, but the percentage increase is 3%, because 6 divided by 200 equals 0.03. If another index moves from 100 to 106, the same 6-point change equals 6%. Index-point changes cannot be compared as though they were percentage rates.
A change in the reference base also changes the displayed levels without necessarily changing the underlying growth rates. For that reason, comparing the raw levels of two countries’ CPI series does not tell you which country is more expensive. Each series has its own basket and reference scale.
Worked example: inflation slows while the price level rises
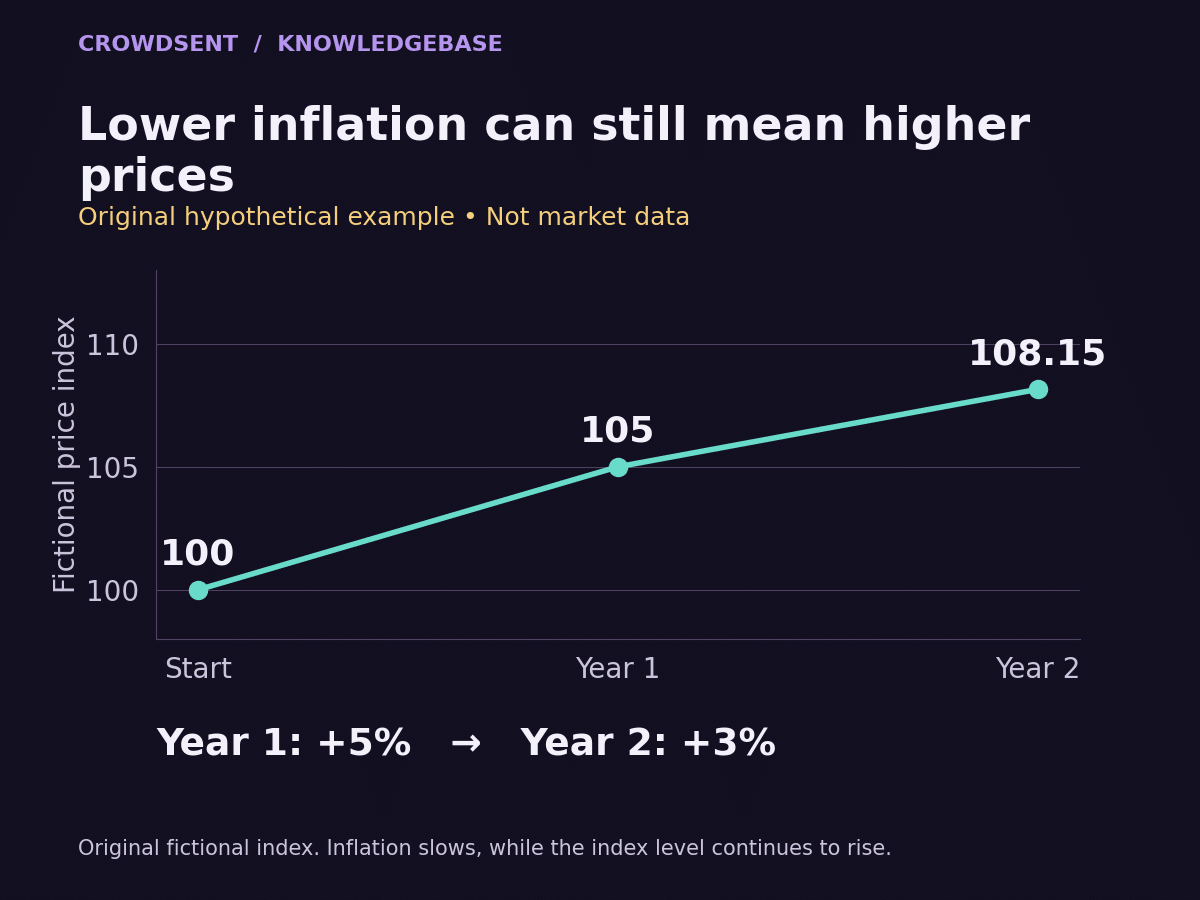
Take a hypothetical index at 100 in Year 0. Prices increase 5% over the next year, taking the index to 105. In the following year, prices rise 3%, taking it to 108.15. Inflation has slowed from 5% to 3%, while the price level has risen from 105 to 108.15.
The two-year cumulative increase is 8.15%, calculated as 1.05 multiplied by 1.03, minus one. Adding 5% and 3% gives 8%, which is close but misses compounding. The second year’s 3% applies to the already higher level of 105.
This example separates disinflation from deflation. Disinflation means the positive rate of price increase is slowing. A falling price level over the stated interval would produce a negative inflation rate. A headline saying inflation has cooled does not, on its own, say that the typical basket became cheaper.
Now imagine a separate hypothetical core index also starting at 100, then rising 4% and 4%. Its later levels would be 104 and 108.16. Headline inflation slows sharply between the two years while core inflation stays at 4%. Both calculations are internally consistent; the series describe different baskets.
The near-equality of the final headline and core index levels in this example is an arithmetic coincidence. It does not show that food and energy had no effect or that the baskets cost the same amount. Raw levels and interval growth rates answer different questions.
Month over month, year over year, and the base effect
A monthly rate compares the current month with the previous month. A year-over-year rate compares the current month with the same month one year earlier. They can send different messages because one uses a short recent interval and the other includes a much longer history.
For a purely arithmetic illustration using one consistently defined index, suppose the current level is 110, the previous month’s level is 109.78, and the level a year earlier is 105. The monthly increase is about 0.20%. The year-over-year increase is about 4.76%. Neither figure cancels the other; they use different denominators.
Now compare two hypothetical observations with the same current level of 110. Against a prior-year base of 100, annual inflation is 10%. Against a base of 105, it is about 4.76%. The latest price level is identical, but the annual rate changes substantially because the comparison base changes.
This is the central intuition behind a base effect. To interpret an annual rate moving lower, examine both the latest monthly movement and the older observations leaving the comparison. A slower annual rate can partly reflect what happened a year ago, rather than a sudden change in the newest month.
Annualizing one monthly rate creates another distinct calculation. A hypothetical 0.2% monthly increase repeated for 12 months compounds to about 2.43%, using 1.002 to the twelfth power minus one. That is a what-if conversion, not a forecast that every coming month will repeat the latest reading.
Keep seasonal adjustment consistent
Recurring seasonal patterns can obscure short-term comparisons. BLS publishes seasonally adjusted and unadjusted CPI data; its seasonal-adjustment FAQ explains the purpose and revision process. In the standard release, commonly quoted monthly changes use seasonal adjustment, while 12-month changes are commonly reported without it.
Do not calculate a growth rate using a seasonally adjusted starting level and an unadjusted ending level. That joins two different series. Label the basis before copying numbers into a spreadsheet, and preserve enough precision to reproduce the published result as closely as the available inputs allow.
A displayed monthly rate rounded to one decimal place does not contain the full precision of the underlying index. Two observations both reported as 0.2% may still differ before rounding. Multiplying rounded monthly rates together will not necessarily reproduce a published 12-month rate exactly.
If a historical chart changes after an update, check whether its seasonal factors or source series were revised. Save the release date when analyzing what readers could have known at a particular moment. The most recent downloadable history and the original release are different research records.
Read headline and core without making either do every job
Imagine a household whose energy bill falls while rent and service costs keep rising. A broader inflation measure and an energy-excluding measure can reflect different parts of that experience. A disagreement between them is a reason to inspect components, not a reason to discard whichever figure is inconvenient.
Neither index promises to match your budget. A person who spends much more on one category than the representative basket can experience a different overall rate of price change. Recording personal expenses is a separate task from reading an economy-wide price index.
Monetary-policy interpretation needs another check. The Federal Reserve explains its inflation assessment and its 2% longer-run goal in terms of the PCE price index on its inflation FAQ. Do not relabel core CPI as the exact target series or infer a guaranteed policy decision from one release.
If an article says CPI “means a rate cut,” trace that claim to the actual policymaking evidence. CrowdSent’s guide to FOMC statements and minutes helps distinguish the documents from commentary about them. An economic release provides information; it does not contain a prewritten market or policy outcome.
A short workflow for checking an inflation headline
- Find the original release and identify the reference month.
- Record headline or core, monthly or annual, and adjusted or unadjusted.
- Separate the index level, percentage change, and change in percentage points.
- Read the major component contributions before proposing a cause.
- Treat analyst forecasts as separately sourced expectations.
- Keep a copy of the release vintage if evaluating a past interpretation.
The phrase “above expectations” requires an expectation source. A consensus forecast is not the same thing as the previous reading, and different forecast collections can have different medians. CrowdSent’s market-news verification guide shows why the original data and the comparison claim both need checking.
End your research journal entry with a precise observation, such as: “In this hypothetical example, annual headline inflation slowed while the index level rose.” That statement preserves the distinction the numbers actually support.
Frequently asked questions
Does core CPI exclude housing?
No. The standard US core CPI definition excludes food and energy; housing-related components remain within its scope. If a commentator uses a narrower custom measure, ask for its exact components rather than assuming that “core” means the same thing.
Why can headline CPI be below core CPI?
Food and energy can have weaker price growth or falling prices relative to the remaining basket. The headline rate can therefore be lower. Compare the same interval and adjustment basis before attributing the gap to particular categories.
Can core CPI fall while headline CPI rises?
Yes. The covered baskets differ, so movement in the excluded categories can push the broader measure another way. Inspect both rates and their component data. One release can contain several valid descriptions of price developments.
Does lower inflation mean lower prices?
Only if the measured inflation rate becomes negative over the interval being discussed. A positive rate that falls from 5% to 3% means prices are rising more slowly. The worked example shows why the cumulative price level can remain higher.
What does a CPI level of 300 mean?
It is an index level relative to the series’ reference base, not a 300% annual inflation rate or a 300-dollar bill. To calculate a rate, compare it with another level from the same consistently defined series over a specified interval.
Can I subtract core inflation from headline inflation to find food inflation?
No. The headline rate combines weighted components, including energy as well as food, and core has its own aggregation. A simple difference between the two published rates is not the food inflation rate. Use the actual component series.
Is the annual average inflation rate the same as December-to-December?
No. One compares averages across two full years; the other compares two particular months. A year containing a sharp change can produce noticeably different answers. State which calculation you mean before comparing an annual summary with a monthly release.
Why does my personal inflation differ from CPI?
Your spending mix, purchase timing, location, and specific products can differ from the representative index. That does not by itself invalidate either your experience or the aggregate. They address different populations and levels of detail.
Should I multiply a monthly rate by 12?
That gives a simple approximation. A compounded annualized rate uses the monthly growth factor raised to the twelfth power. Neither calculation predicts the next year. Specify the method and avoid annualizing rounded data with more precision than it supports.
Does a US CPI release measure inflation in India or Pakistan?
No. The geography belongs to the statistic. US CPI can provide context for global economic discussion, but domestic inflation questions require the relevant country’s official series, definitions, and comparison periods. Do not substitute one national basket for another.
Educational information only. Examples are hypothetical and are not forecasts, recommendations, or investment advice.