

By CrowdSent Blog Team
Leading, coincident and lagging economic indicators describe when a measure tends to turn relative to a defined economic cycle. A leading measure turns earlier, a coincident measure around the same time, and a lagging measure later. Those labels are useful only when the reference cycle is clear.
Two releases can therefore point in different directions without either being wrong. One may describe weakening expectations while another records activity that is still expanding. Before choosing a headline to believe, separate what each series measures, which period it covers and when the information became available.
Start with “leading relative to what?”
The Conference Board’s description of business-cycle indicators explains the three categories through their historical turning-point relationship with aggregate economic activity. Its linked component table is labelled April 2008, so it should not be treated as a current index composition.
A timing label needs a reference. “Indicator A leads the cycle” is incomplete unless the cycle has been defined. A peak in the level of output and a peak in growth relative to trend answer different questions. An economy can continue growing while its growth loses momentum. Write down which event your comparison is trying to identify.
Also distinguish a recurring historical relationship from a single coincidence. One early turning point makes a useful example; it does not establish a reliable classification across many cycles. A source’s methods and evaluation period matter more than an appealing chart alignment.
Leading, coincident and lagging economic indicators: a fictional timeline
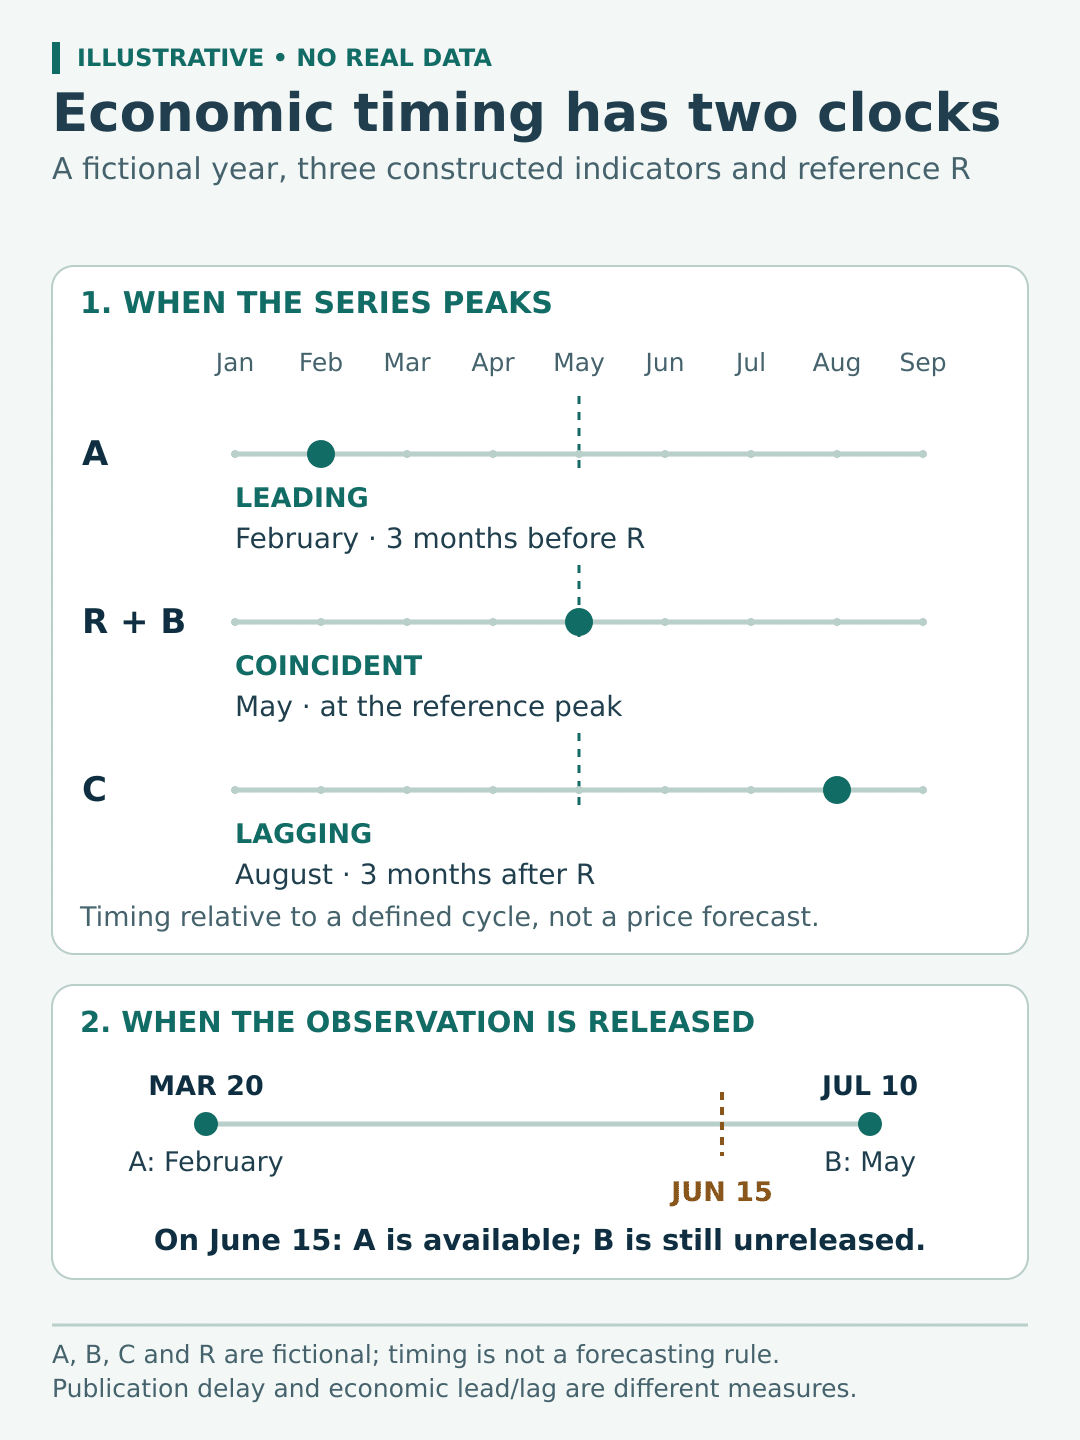
The following teaching example is entirely fictional. The letters represent constructed series, and the months describe one invented year. They are not observations, estimates or forecasts for any country.
- February: indicator A reaches a peak, then declines.
- May: the selected reference cycle reaches a peak. Indicator B peaks in the same month.
- August: indicator C reaches its peak after continuing upward through the spring and early summer.
Within this example, A leads the reference peak by three months, B is coincident, and C lags by three months. The calculation uses the months represented by the series: May minus February, and August minus May.
On the constructed economic timeline in June, A is falling, B has recently turned and C is still rising. Calling the evidence “contradictory” would hide its sequence. A more precise note says that the three constructed measures are at different points around the same reference peak.
Nothing in this timeline specifies a market price. It also says nothing about the severity or duration of the downturn. The example isolates timing so those additional claims cannot slip into the conclusion.
Keep publication delay on a separate clock
Add publication dates to the fictional example. Suppose A’s February observation became available on March 20, while B’s May observation appeared on July 10. A research note written on June 15 could use the February release of A, but it could not use B’s unreleased May observation.
B remains coincident in the constructed economic timeline even though its information arrives later. Publication delay is the distance between a measured period and its release. Economic lead or lag is the relationship between movements in the indicator and the reference cycle.
This distinction changes a historical review. Ask both “Where did the series turn?” and “What could someone have known on that date?” Keep the original release separately from any later revision. CrowdSent’s guide to verifying the release source provides a useful starting point for checking the document behind a headline.
Understand the narrower claim of a composite index
The OECD composite leading indicator definition focuses on turning points in activity relative to its long-term potential. It describes short-term movements qualitatively. That supports a discussion of changing cyclical direction, rather than an exact GDP-growth estimate or a market-price target.
The OECD’s CLI methodology questions explain that lead times vary, inputs are selected by country, and series are revised. The form of the CLI must also match the form of the reference series: an amplitude-adjusted CLI is compared with a detrended reference, rather than an untransformed GDP level.
For a reader comparing India, Pakistan and the United States, the first task is to identify a genuine country series and its documentation. A global website’s country menu does not prove that a particular dataset covers that country. Do not relabel a US classification or another country’s composite as local evidence.
Use this six-field comparison checklist
Complete these six fields before writing the interpretation. They work for a pair of indicators or a longer research note.
- Country and source: name the economy, producer and exact series identifiers. Note any coverage mismatch.
- Reference cycle: identify what is being led or lagged, including the event used as the turning point.
- Measurement form: record level or growth rate, frequency, units and relevant transformations.
- Economic and publication timing: save the reference period and the release date separately for each observation.
- Vintage: record which dated version you used and whether it was available at the time being studied.
- Relationship and uncertainty: state the observed ordering, the comparison window and what remains untested.
A completed fictional entry might read: “Constructed economy; A and reference R; monthly cycle measures; February and May peaks; releases on March 20 and July 10; original fictional releases; A leads this peak by three months, with no evidence here about other cycles.”
Use the market research journal template to preserve the comparison. A useful conclusion identifies what the evidence supports and the next missing check, without turning a timing label into a trading instruction.
Frequently asked questions
Does “leading” mean the indicator is published first?
No. It describes a relationship with an economic reference cycle. Publication order is a separate comparison. Record both before assessing how useful an indicator would have been in real time.
Can a coincident indicator be released after the period it describes?
Yes. In the fictional example, B peaks with the reference in May but is released in July. Its release delay does not change the economic relationship constructed in the example.
Does “lagging” mean the information is useless?
No. A later-moving measure can help describe how a cycle unfolded. Whether it is useful depends on the question: reconstructing a sequence differs from seeking an early indication.
Can three correctly measured indicators move in different directions?
Yes. Check whether they refer to different periods, concepts or cycle stages. The fictional June comparison shows how an earlier decline and a continuing rise can coexist.
Is a lead of three months a fixed forecasting rule?
No. That number belongs only to this invented example. A real claim would need a documented comparison across relevant turning points, with variation and failures kept visible.
Does a declining leading index prove output is contracting?
No. First establish whether the index refers to activity relative to trend or another cycle concept. A loss of momentum alone does not quantify the change in total output.
Can I apply a US indicator classification directly to India?
Do not assume the relationship transfers. Verify the local series, coverage and reference cycle. A familiar name can conceal different measurement and timing choices.
Does an OECD country page establish a Pakistan CLI series?
No. Country navigation and dataset coverage are different evidence. Require an identifiable Pakistan series in the relevant dataset before making that claim.
Why keep the first release when a revised series is available?
The two versions answer different research questions. A real-time review needs information available then; a later description may use revised data, clearly labelled with its vintage.
Can this framework predict a currency, equity or crypto price?
The framework organizes economic timing. It supplies no price model, probability or investment recommendation. Any separate market claim needs its own evidence and assumptions.
Source documentation checked 12 October 2026. Educational explanation from the CrowdSent Blog Team. Numerical examples and identifiers are fictional unless stated otherwise. This article does not provide investment recommendations.