

VWAP means volume-weighted average price. It combines prices using their associated trading quantities as weights over a defined interval. Understanding VWAP meaning begins with that connection: a price attached to more included volume has more influence on the result than a price attached to less volume.
The definition sounds straightforward, but a displayed VWAP still depends on several choices: which trades or bars are included, which price represents a bar, what volume means, and when accumulation starts or resets. Two values can disagree because their measurement boundaries differ, even when both calculations are internally correct.
This guide works through a fictional trade record and compares it with a common chart approximation. It does not provide a trading strategy or suggest that a benchmark guarantees an executable price.
VWAP meaning starts with value divided by quantity
For individual included trades, multiply each trade price by its quantity. Add those products and divide by the sum of the quantities: VWAP = total traded value ÷ total traded quantity. Use consistent price and quantity units throughout.
Interactive Brokers’ VWAP glossary describes this trade-level construction for shares. A price quoted in rupees per share multiplied by a share quantity gives rupees of traded value. Dividing that total by total shares returns rupees per share.
This is a quantity-weighted mean, rather than a simple average of the recorded price labels. If all included quantities are equal, the two calculations coincide. If quantities differ, treating every trade as equally important can produce a different answer.
The interval is part of the definition. A VWAP from a session’s opening to noon and a VWAP from noon to its close summarize different transactions. Neither should be called “the day’s VWAP” without explaining whether the day is complete and what the day includes.
Calculate VWAP from four fictional trades
Suppose the first three trades in our selected interval are 100 shares at a price of 100, 300 shares at 102 and 100 shares at 99. Prices are hypothetical rupees per share, with no fees included.
- Trade 1: 100 × 100 = 10,000 rupees of value
- Trade 2: 102 × 300 = 30,600 rupees of value
- Trade 3: 99 × 100 = 9,900 rupees of value
Total value is 50,500 and total quantity is 500 shares. VWAP is 50,500 ÷ 500 = 101. The unweighted average of the three price labels is (100 + 102 + 99) ÷ 3, or approximately 100.3333. The larger trade at 102 explains why the quantity-weighted result is higher.
Now add trade 4: 500 shares at 105, contributing 52,500 of value. Cumulative value becomes 103,000 and cumulative quantity becomes 1,000 shares. Updated VWAP is 103,000 ÷ 1,000 = 103.
The last trade price is 105, while VWAP is 103. One is the most recent included transaction price; the other is the weighted mean over the chosen interval. They need not be equal, and the difference does not establish whether 105 is fair value.
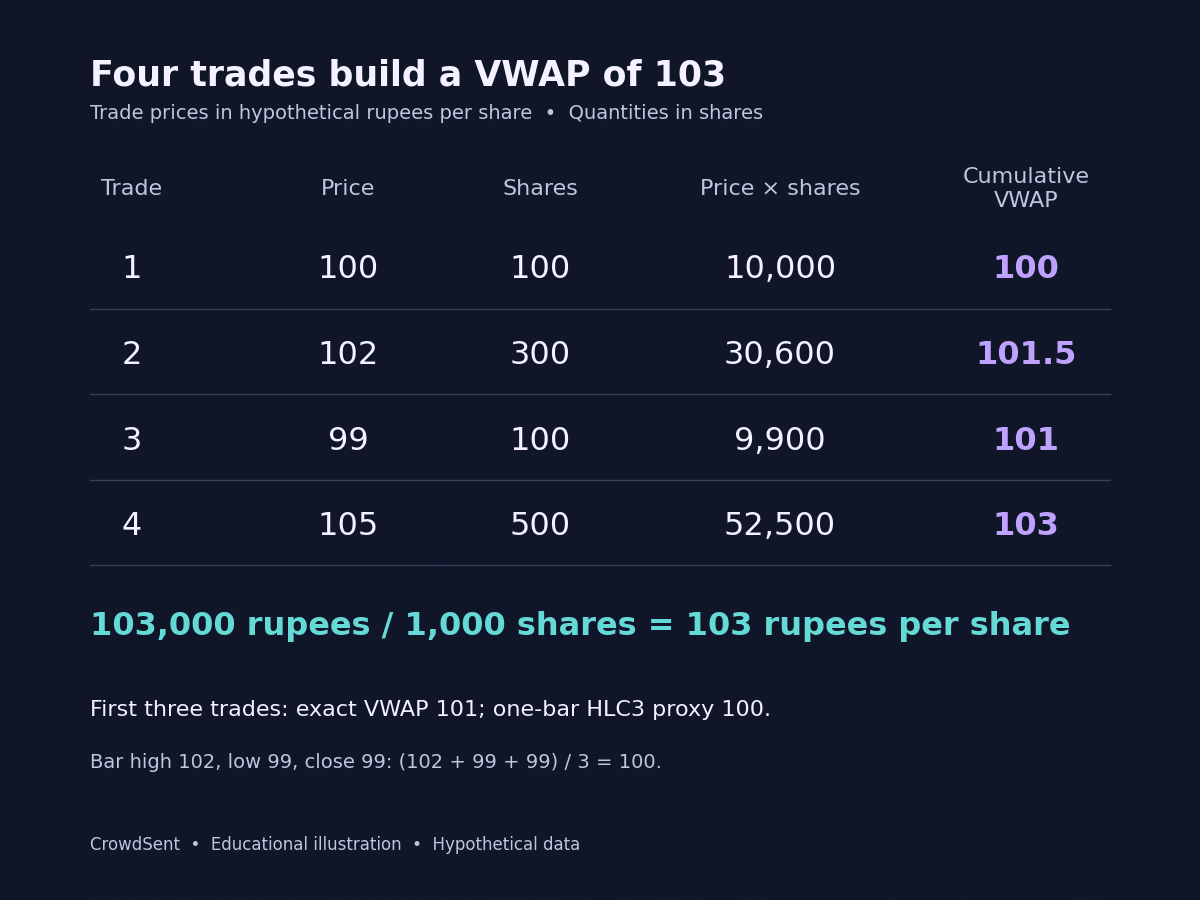
To reproduce the calculation, keep columns for trade price, share quantity, their product, cumulative product, cumulative quantity and cumulative VWAP. The successive VWAP values are 100, 101.5, 101 and 103. Each step can be checked without charting software.
Check VWAP against the included price range and quantity units
With non-negative quantities and positive total volume, VWAP must lie between the lowest and highest prices carrying positive weight in its included dataset. Dividing each quantity by total quantity creates weights that sum to one. The resulting weighted mean cannot exceed every included price or fall below all of them.
For the four trades above, the weights are 0.1, 0.3, 0.1 and 0.5. Their weighted sum is 0.1 × 100 + 0.3 × 10² + 0.1 × 99 + 0.5 × 105 = 103. The value sits inside the included range of 99 to 105. A result of 106 would fail this check for that exact four-trade record.
Changing the quantity unit consistently should also leave the result unchanged. Express the quantities in hundreds of shares: 1, 3, 1 and 5. The numerator becomes 1,030 and the denominator 10, again giving 103. Dividing the original numerator of 103,000 by the rescaled denominator of 10 would produce 10,300, revealing a unit mismatch.
Use the range belonging to the full accumulation window, rather than just the latest bar. For a bar-price approximation, check against the included proxy-price range. Passing these tests does not prove complete coverage: a missing trade can still leave an apparently plausible average inside the range.
See how accumulated volume changes the next update
The update can also be written as: new VWAP = old VWAP + [new quantity ÷ new cumulative quantity] × (new price − old VWAP). This is an algebraic rearrangement of the weighted-mean formula.
Before trade 4, old VWAP is 101 and accumulated quantity is 500. The new trade also contains 500 shares, so its weight in the new total is one-half. The update is 101 + 0.5 × (105 − 101) = 103, matching the cumulative calculation.
If a fifth trade contains only 10 shares at 110, cumulative value becomes 104,100 and quantity becomes 1,010. VWAP is approximately 103.0693. The latest price is seven units above the previous VWAP, yet its small quantity moves the accumulated mean by only about 0.0693.
That behaviour explains why a cumulative VWAP may react modestly late in an interval with substantial earlier volume. It does not mean late trades are ignored. Their weight is measured against everything already included since the anchor.
Why a chart’s bar approximation can differ
A chart may not calculate from every individual trade. A common method assigns each bar its typical price, (high + low + close) ÷ 3, multiplies that by bar volume, and divides cumulative products by cumulative volume. TradingView’s VWAP documentation describes that construction and its selectable source and anchor period.
Combine our first three trades into one bar. Its high is 102, low is 99 and close is 99. Typical price is (102 + 99 + 99) ÷ 3 = 100. Multiplying 100 by the bar’s 500 shares and dividing by 500 yields a bar-based value of 100.
The exact trade-based value for those same three trades was 101. The difference arises because high, low and close do not retain the quantity executed at each price. A bar’s total volume cannot restore information lost when all its trades are compressed into a few price fields.
Using smaller bars can preserve more detail, but it does not guarantee an exact trade-level result. A smaller bar can still contain several prices and unequal quantities. Changing the chart interval can therefore change an HLC3-based VWAP even when the intended overall session remains the same.
There is an exact aggregation route when each bar supplies its own true trade-level VWAP and its volume. Weighting those bar VWAPs by their volumes recovers the overall trade-level result, provided the bars cover the same complete, non-overlapping trade set. A typical price is not automatically that bar VWAP.
Define the reset and the included session
A session VWAP restarts its cumulative numerator and denominator at the specified session boundary. An anchored VWAP starts from a selected event or observation. A weekly anchor accumulates over a different window again. Record the actual start, rather than assuming every tool resets at your local midnight.
If the fourth trade in our example belongs to a new selected session, its first VWAP is 105. If it belongs to the original session, the cumulative result is 103. The same transaction has produced different displayed numbers because the earlier records either remain included or have been excluded by the reset.
For Indian and Pakistani readers inspecting overseas markets, distinguish the chart’s display clock from the exchange session. A time-zone relabelling may leave the included trade set unchanged. A session filter that removes pre-market or overnight activity changes the actual inputs.
Across a stock split, an anchor spanning the event needs consistent price and quantity units. Check how the provider adjusts historical prices and volumes. Combining restated prices with quantities expressed on a different share basis can change the weighting in unintended ways.
Check what the volume field counts
Volume may mean shares, contracts, base-asset units or a count of price updates. TradingView’s volume-data explanation distinguishes traded volume from tick volume and notes that some instruments lack volume data. A tick-weighted calculation has a different interpretation from one weighted by executed share quantity.
Do not substitute monetary turnover for quantity without changing the definition. For two trades of one unit each at 100 and 200, ordinary quantity-weighted VWAP is 150. If their traded values of 100 and 200 are used as weights instead, the result is (100 × 100 + 200 × 200) ÷ 300, approximately 166.67. That is a different statistic.
A valid zero-volume bar contributes nothing to the numerator or denominator. Before any positive included quantity exists, the ratio has a zero denominator and is undefined. Missing volume is another case entirely. The guide to missing market data versus zero explains why an unavailable value should not be silently treated as an observed zero.
Volume also does not reveal the available depth at the current quote. Read liquidity versus volume for that distinction. For derivatives, open interest versus volume explains why outstanding contracts are not a substitute for the traded quantity used in this calculation.
Make the benchmark reproducible
A useful VWAP note includes instrument and venue, currency, interval start and end, session filter, price source, volume unit, aggregation method and whether the final interval is complete. Retain any treatment of trade corrections, auctions, missing records or corporate actions documented by the provider.
When comparing an execution with a benchmark, first make their populations and timing comparable. A market-wide full-session figure answers a different question from an average over the short interval when an order was active. Fees and other execution costs also need their own accounting.
The defensible conclusion in our example is precise: four included trades, 1,000 shares, 103,000 rupees of value and a trade-based VWAP of 103. That statement is useful because its inputs can be checked. It makes no claim about future price direction or the ability to transact at 103 afterward.
Frequently asked questions
What is the simplest VWAP formula?
Add price multiplied by quantity for every included trade, then divide by total included quantity. Specify the interval and units. If using bar data, state the representative price assigned to each bar and recognise the resulting approximation.
Is VWAP the average of all quoted prices?
Not necessarily. A trade-based VWAP uses executed prices weighted by quantities, rather than every displayed quote. A chart built from another source can follow a different convention. Inspect the provider’s field definitions before describing the result.
Does VWAP always reset daily?
No. Session resets are common, but anchors can be weekly, monthly or event-based. A selected start point also changes what is included. The word VWAP alone does not define its accumulation window.
Can VWAP differ from the latest price?
Yes. VWAP reflects all included weighted observations since its anchor. The latest price describes the newest included observation. In our four-trade example, the latest price is 105 and the accumulated VWAP is 103.
Why can changing chart timeframe change VWAP?
If each bar is represented by high-low-close average or another proxy, regrouping trades changes those proxy prices and their weights. Exact trade-based aggregation over an identical trade set would not change merely because the display interval changed.
What happens if all included volume is zero?
The denominator is zero, so VWAP is undefined. Once positive volume has accumulated, a genuine zero-volume bar adds no weight. Missing volume requires a separate treatment and should not automatically be converted to zero.
Is tick volume equivalent to traded quantity?
No. Tick volume typically counts price updates rather than shares or contracts exchanged. A weighted mean using that field measures a different population. Check the source and name the weighting basis explicitly.
Is VWAP the same as a volume-weighted moving average?
They can use similar weighted-mean arithmetic, but their windows commonly differ. A cumulative VWAP retains observations since its anchor, whereas a rolling volume-weighted average drops observations outside its chosen window. Verify the implementation’s actual boundaries.
Does a price above VWAP prove that it is expensive?
It establishes a relationship with that particular historical weighted mean. It does not measure fundamental value or establish a future reversal. A different anchor, volume source or included venue may also produce a different comparison.
Can I execute an order at the displayed VWAP?
The chart value itself does not promise an available transaction price or fill. It is a calculated reference for an identified dataset. Any execution service has its own conditions, timing and costs, separate from the displayed indicator.
Educational information only. All numerical examples are hypothetical. This article provides no investment recommendation or forecast.