

CrowdSent Blog Team · Market-depth education
The useful distinction in liquidity vs volume is between trading conditions and completed activity. Trading volume counts what changed hands during a defined interval. Market liquidity concerns the quantities that can be exchanged, the associated price effect and how conditions recover after disruption. A busy market can still have little displayed quantity near its current price.
Your research task is to decide what a volume total and an order-book snapshot jointly establish. The answer depends on their units, coverage and timing. This guide builds that judgement using two invented venues, a static order book and a separate recovery example. It focuses on depth and resilience rather than treating a daily activity total as a complete liquidity score.
The examples use a fictional USD-quoted asset for arithmetic. USD is only a reporting reference. Readers in India and Pakistan should preserve their own INR or PKR quote labels and source time zones. No example describes current market conditions, product availability or a suggested transaction.
1. Read the trading volume counter before interpreting it
An activity counter needs a unit and a window. The displayed number might count base-asset units, quote-currency value or individual transactions. Those are different measurements. A caption reading “volume: 10,000” is insufficient until you know what was counted and when the counter started and ended.
Coinbase’s dataset field descriptions distinguish trade quantity in the base currency from price in the quote currency. Their aggregated dataset documentation also separates trade count from volume and identifies interval boundaries. This is a useful primary example of why field definitions matter; other datasets must be checked on their own terms.
Hypothetical ledger: one invented transaction exchanges 10 units at USD 100 each and a second exchanges 10 units at USD 110. The ledger contains two trades, 20 base units and USD 2,100 of quote-currency value. Multiplying 20 by the final price of USD 110 would give USD 2,200, overstating this ledger’s executed value.
The same units can change hands more than once. Consequently, an interval’s volume does not reveal the number of distinct units held at its end or how many different people participated. Those questions require identifiers and rules that an aggregate total may not contain.
Check whether the window rolls continuously or resets at a calendar boundary. A rolling 24-hour figure collected at noon cannot be compared uncritically with yesterday’s fixed daily total. Record the source’s boundary in UTC, then add the local time if useful. Converting the clock label should not silently change which transactions belong in the interval.
2. Define the market depth you are measuring
A displayed order book lists quantities at price levels for a particular venue and pair. To turn that list into a comparable depth measurement, specify the side, reference price, distance from that reference and observation time. “Depth near the market” is too vague to reproduce.
Coinbase’s public product-book documentation describes a product-specific list of bids and asks. It includes controls for the number of entries returned and price increments used for grouping. Those settings illustrate how two requests can expose different detail even when they concern the same pair.
For the worked example below, define ask-side depth as the sum of displayed base units from the best offered price through 1% above it, including the boundary. That definition is an editorial choice for this exercise. It is neither a universal liquidity standard nor a claim about which measurement every provider uses.
Keep bid-side and ask-side totals separate. A large quantity on one side does not establish an equally large quantity on the other. Similarly, ten displayed price levels could cover a narrow range in one market and a much wider range in another. Match price distance when the question concerns quantities near a reference.
A band measured from the best offer differs from one centred on a midpoint or last trade. Write your anchor next to the percentage. If a provider groups several raw prices into one displayed level, record that grouping before interpreting a concentration as a single order or a single participant.
3. Compare liquidity vs volume with two fictional order books
Every venue, price and quantity in this worked case is hypothetical. Venues Amber and Blue both display the invented LUM/USD pair. Their preceding 60-minute volume windows match exactly. At the shared end-of-window snapshot, Amber reports 10,000 LUM of completed activity and Blue reports 4,000 LUM.
Their displayed ask-side books are deliberately simple. Assume the listed quantities are all the visible asks relevant to this exercise. The best offered price is USD 100 on both venues. Nothing in this example implies that the books remain unchanged after the snapshot.
- Amber asks: 2 LUM at USD 100, 3 LUM at USD 101 and 5 LUM at USD 104.
- Blue asks: 20 LUM at USD 100, 30 LUM at USD 101 and 50 LUM at USD 104.
- Within the defined 1% band: include USD 100 and USD 101. Exclude USD 104.
- Calculated displayed depth: Amber has 5 LUM; Blue has 50 LUM in that band.
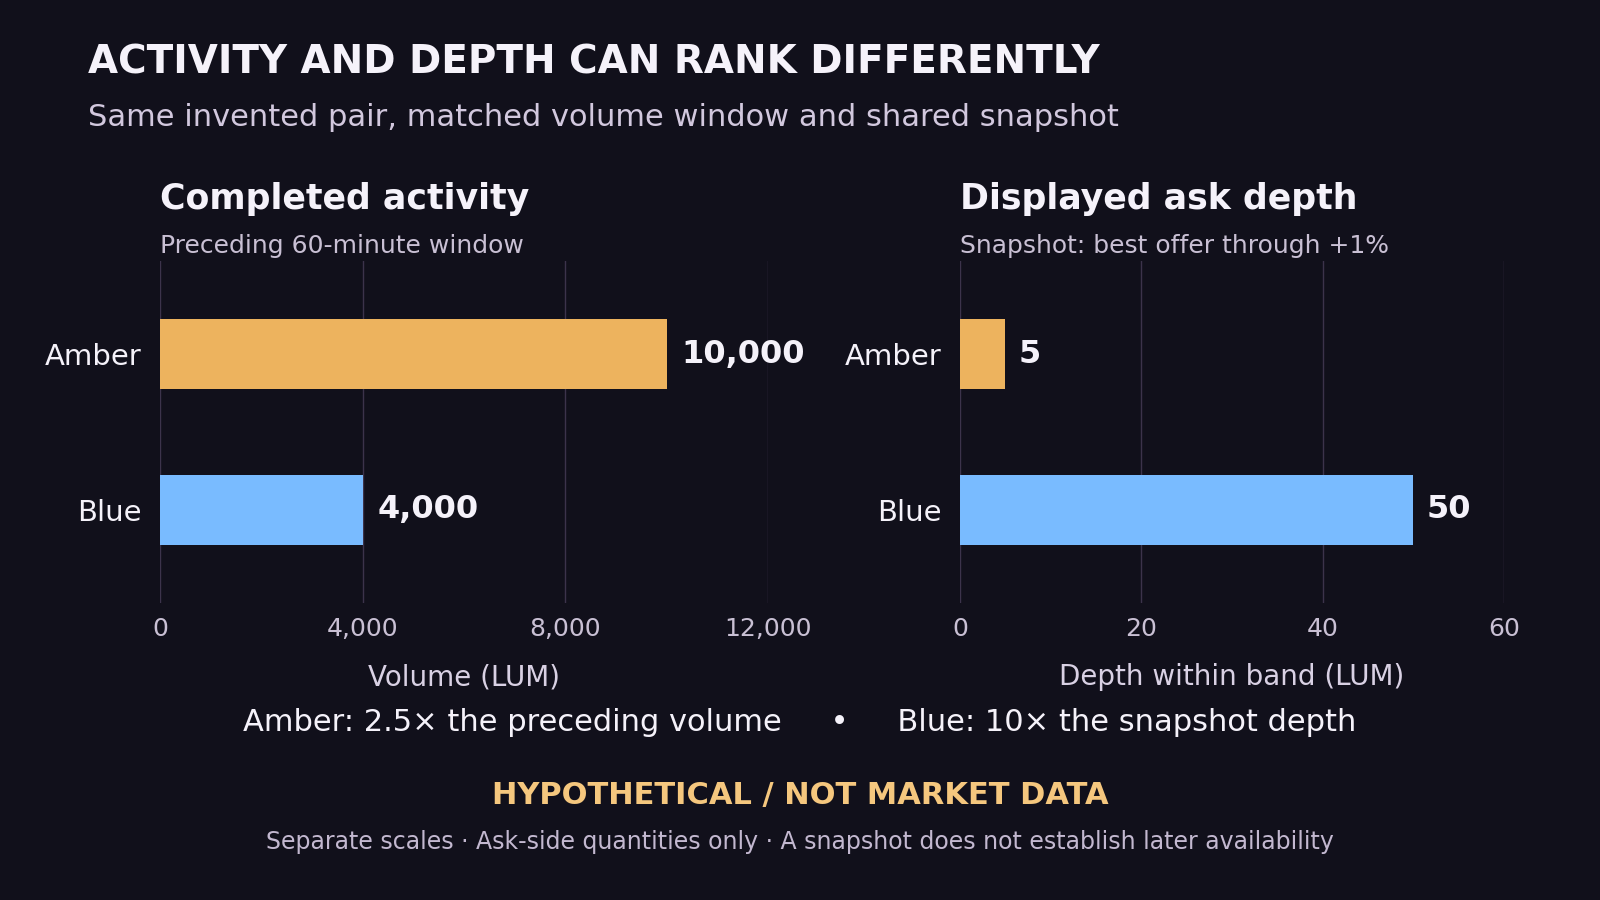
Amber recorded 2.5 times Blue’s preceding activity, while Blue displays ten times Amber’s current ask quantity in the chosen band. Both observations are internally consistent. The volume window describes completed transactions; the snapshot measures visible quantities at one instant. Neither number needs to be wrong for their ordering to differ.
A static quantity test explains the distinction
To examine the books mathematically, consider a purely hypothetical eight-unit quantity. Freeze every listed order and ignore fees, cancellations, new orders and competing activity. Under those artificial assumptions, Amber’s first eight units comprise two at 100, three at 101 and three at 104. Their combined value is USD 815, giving a weighted average of USD 101.875 per unit.
Blue’s first eight units all fit inside the 20 units shown at USD 100, giving USD 800 in total and an average of USD 100. This calculation exposes a difference in the shapes of the two frozen books. It is an educational counterfactual, not an execution quote or a prediction about an actual order.
Change the quantity and the comparison may change. A two-unit calculation would fit at the best offer on both books. This is why a statement about depth should name the quantity or band it concerns. It also explains why identical top-of-book prices cannot, by themselves, establish identical conditions farther into the book.
The evidence still says nothing about the bid side, other venues or the next minute. The disciplined conclusion is limited to the displayed ask-side snapshot and the completed volume interval. Extending it requires additional observations, not a more confident adjective.
4. Observe resilience through a sequence of snapshots
Depth describes an observation. Resilience requires a sequence: how does the chosen liquidity measure behave after a disturbance? A BIS study of liquidity and resilience distinguishes these concepts and explains that recovery can be measured in different ways. Its empirical setting is government bonds; it does not establish the conditions of a crypto pair.
For your own research, define recovery before examining the result. You might track whether a specified depth measure returns to a chosen fraction of its pre-event level. Record the reference window, observation frequency and event time. A threshold selected after seeing the chart can make a weak recovery look more decisive than it was.
Separate hypothetical recovery exercise: two invented books each show 1,000 base units in a defined band before an event and 200 immediately afterward. One minute later, the first shows 800 and the second 250. Using a preselected threshold of 80% of the original 1,000 units, the first observed series meets the threshold at that minute; the second does not.
That statement is narrower than saying the first market is always resilient. With only minute-spaced observations, you cannot locate the precise recovery second or know whether the depth briefly recovered and disappeared between samples. Nor can you assume both sides of the book recovered when you measured only one.
If the reference price moves, decide whether the band follows it or remains fixed. A moving band measures quantities near the new price. A fixed band measures quantities near the original price. Both can answer legitimate questions, but combining them within the same series destroys the consistency of the test.
5. Separate crypto liquidity observations from coverage limits
A single exchange pair is one observation location. Adding volume from many venues does not turn one venue’s snapshot into a market-wide order book. Before comparing aggregate activity with local depth, explain the mismatch. The combined view may provide context, but it cannot establish quantities at unobserved venues.
Currency conversion introduces another boundary. A USD-quoted pair and a stablecoin-quoted pair have different quote assets even when their displayed amounts look close. An INR or PKR conversion may make monetary labels easier to read, but it does not merge participants, timestamps or available quantities across those pairs.
Check truncation explicitly. If a response contains only the first five price levels and those levels do not reach your chosen boundary, the sum is an observed partial quantity. Reporting it as total band depth would imply coverage you do not have. Mark the result incomplete or obtain a sufficiently detailed observation.
Also separate three states in the research record: observed zero, unavailable observation and stale observation. An empty local file after a failed request cannot establish an empty order book. A successful response carrying an old timestamp cannot establish present conditions. Preserve the response status and source time rather than filling the gap automatically.
For a claim circulating online, ask whether the screenshot includes pair, venue, date, band and units. Use the market-news verification process to locate its original context. When several accounts repeat the same image, that repetition adds visibility without adding independent order-book evidence.
A displayed wall of quantity can change after collection. A single screenshot cannot establish why it disappeared, who controlled it or whether all of it could have been matched under later conditions. Claims about deceptive intent need evidence beyond a before-and-after visual difference.
6. Write a conclusion that separates activity, depth and recovery
Build the conclusion around three statements, each attached to its own evidence. First describe completed activity for the named window. Next describe the displayed book quantity at the snapshot. Finally state what the available time sequence does or does not establish about recovery. This preserves useful findings without collapsing them into an undefined “liquidity is good” label.
For the Amber and Blue exercise, a complete summary reads: “Amber recorded more LUM volume in the matched preceding hour. Blue displayed more ask-side LUM within 1% of the best offer at the shared snapshot. We have no sequence that tests replenishment, and neither observation describes the bid side.” Every clause has a clear measurement behind it.
When discussion becomes more enthusiastic at the same time as activity rises, treat that as a separate observation about the conversation. The guide to evaluating trading-community discussions can help distinguish a measurable claim from a repeated interpretation. Commentary cannot supply missing book levels or establish quantities that were never observed.
- Reproducibility: save the venue, pair, source time, retrieval time, interval and exact units.
- Depth definition: save the side, anchor, band, grouping and truncation status.
- Computation: preserve the original rows and show the sum or weighted-average calculation.
- Boundary: state which sides, venues, times and recovery questions remain unobserved.
Keep those details in a market research journal entry. Revisit the conclusion when a missing observation becomes available or a source corrects its data. A later update should explain what new evidence changed the interpretation, rather than quietly replacing the original measurement.
Frequently asked questions about liquidity vs volume
Can high trading volume coexist with shallow market depth?
Yes. The Amber and Blue example shows exactly that combination: the busier preceding hour belongs to the venue with fewer displayed ask units at the later snapshot. Before calling the result unusual, check whether the activity interval and the depth observation concern the same venue, pair, currency and time boundary.
Does low volume prove that a market is illiquid?
A quiet interval alone cannot establish the quantities available near a price. It may simply contain few completed transactions. Inspect a defined book snapshot and, where available, a time sequence. Keep the claim limited to what those observations reveal instead of interpreting an unused opportunity to transact as proof that none existed.
What does one percent depth mean?
It needs a precise anchor and side. In this article, ask depth runs from the best offer through a price 1% higher, including the endpoint. Another dataset might measure around a midpoint or use both sides. The label is incomplete until its reference, units, aggregation and observation time are specified.
Why is trade count different from traded quantity?
One large transaction and many small transactions can exchange the same total quantity. Trade count describes the number of recorded events; volume sums the units or value assigned to those events. Neither statistic alone identifies how many distinct participants were involved, especially when the dataset lacks participant identifiers.
Can I compare a rolling 24-hour figure with today’s volume?
Only after confirming the actual start and end of each interval. “Today” may mean a venue-defined calendar day, while a rolling figure ends at the retrieval time. Match the windows or label the mismatch. Local midnight in India or Pakistan does not automatically coincide with a source’s UTC boundary.
Is a displayed order-book total guaranteed to remain available?
A snapshot records what the source displayed at its stated time. The static calculation above deliberately freezes it to expose the arithmetic. Actual subsequent conditions can differ. A research note should therefore distinguish an observed book, a frozen-book scenario and any separately documented completed transactions.
How can I measure whether depth recovered after an event?
Choose a consistent depth definition, pre-event baseline, recovery threshold and observation frequency. Then inspect the post-event sequence. Report the earliest observed threshold crossing rather than inventing a precise time between samples. If observations stop before recovery, report that the available window did not establish it.
Does an empty response mean zero liquidity?
First check whether the request succeeded, which product it addressed, its timestamp and what an empty response means in the source documentation. Missing or malformed data is a collection result, not a market conclusion. Even a valid empty snapshot concerns the specified source and time rather than every possible venue.
Can sentiment or social activity fill gaps in liquidity data?
They can help identify claims worth checking, but their units count or summarise discussion rather than executable quantities. More posts cannot reconstruct an absent book snapshot. Preserve discussion evidence separately, identify the concrete liquidity claim and seek the original venue observation needed to evaluate it.
What is the minimum defensible conclusion when I only have volume?
State the measured activity, unit, venue or coverage set, and interval. You can compare matched volume observations while leaving depth and resilience unassessed. Avoid assigning a complete liquidity label from that single field. Naming the missing measurements makes the note more useful for whoever continues the research.
Source documentation checked 7 October 2026. Educational research guidance from the CrowdSent Blog Team. Every worked example uses invented figures and is labelled hypothetical. Static-book calculations are explanatory scenarios and provide no investment recommendation.