

CrowdSent Blog Team · Market research basics
The essential difference in open interest vs volume is time: open interest counts outstanding derivative contracts at a stated point, while volume counts contracts traded during a stated interval. One describes what remains open; the other describes activity during the period. They answer different questions even when both appear beside the same price.
That distinction helps when an options screenshot or futures headline claims that a large number proves strong conviction. Before accepting the interpretation, check the units, contract, reporting time and calculation. This guide walks through five checks using fictional examples rather than live market readings or trading signals.
1. Read the units in open interest vs volume
For derivatives reported in contracts, a trade involving five contracts contributes five to volume, rather than ten for its two sides. Open interest also counts an outstanding contract once. CME Group’s column guide explains its contract-based volume, open-interest and daily-change fields. Its definitions describe CME reporting; check the fields supplied by your own exchange or provider.
Do not assume every number on a screen uses that unit. Shares, contracts, underlying units, premium turnover and notional value need different labels. India’s NSE derivatives reports page distinguishes contract counts from value, including its note that displayed options value is premium turnover. A rupee-denominated amount cannot be substituted for a contract count.
A fictional unit conversion
Suppose an invented contract represents 40 underlying units. A position count of 750 contracts corresponds to 30,000 underlying units: 750 × 40. If a second display shows “30,000” in underlying units, the two displays may agree. They would disagree if both claimed to show contracts for the same scope and timestamp.
The multiplier of 40 is invented for this example. It is not a standard lot size for Indian or Pakistani products. Record the actual specification and its effective date before converting. Keep the original number beside the converted figure so a later reader can reverse your calculation.
Similarly, label INR and PKR explicitly when discussing value. “Rs 2 lakh” identifies a scale but can leave the currency unclear for a cross-border audience. Writing “INR 200,000” or “PKR 200,000” removes that ambiguity. Neither amount tells you how many contracts traded without additional information.
2. Match the contract and market coverage
A useful comparison starts with an exact identity. For a futures contract, retain the underlying, exchange and contract month or expiry date. For an option, also retain the strike and whether it is a call or put. Copy the identifier from the source instead of shortening it until two different instruments look identical.
Then identify the aggregation. Is the figure for one expiry, all expiries, one option series, all calls, or an entire product group? Is the source exchange-specific or a combined report? Similar-looking totals can describe different collections, and adding a component to a total that already includes it double-counts that component.
A fictional expiry comparison
Imagine two reports with identical coverage and reporting times. Earlier open interest is 900 contracts in the near expiry and 600 in the later expiry, for 1,500 combined. The next report shows 500 and 1,000 respectively, still 1,500 combined.
The near expiry decreased by 400 and the later expiry increased by 400. A statement about the near expiry alone would miss the unchanged combined count. The pattern is consistent with a shift between expiries, but these aggregate figures do not identify the participants or prove that the same positions were rolled.
For a research note, keep both rows and the total. Say which comparison answers your question. If you only have one expiry, leave the broader product conclusion unresolved rather than estimating the missing row from a headline.
3. Match the snapshot to the activity interval
The Options Industry Council’s FAQ explains that OCC reports open interest after end-of-day clearing. Treat that as a US options example; check your own source’s update schedule.
For your selected source, record the open-interest as-of time, the volume interval, the publication time and any delay notice. A current page-access time establishes when you viewed the page. It does not establish when every field was measured. Mark an unknown timestamp as unknown.
Translate the time without changing the session
In a hypothetical note, 10:00 UTC on 7 October is 15:30 India Standard Time, UTC+05:30, and 15:00 Pakistan Standard Time, UTC+05:00. These are clock conversions, not claims about exchange opening or closing times. Preserve the source’s trading-date label as well, especially for a session spanning midnight.
Suppose session volume is 1,200 contracts and the previous published open interest is 600. Dividing 1,200 by 600 gives 2.0. Label this “session volume divided by previous published open interest.” It does not mean each outstanding contract changed hands twice or that 1,200 new positions remain open.
Our guide to reading historical sentiment uses the same research discipline: preserve the window and coverage before comparing observations. A visually aligned chart can still combine differently timed inputs.
4. Separate trading activity from changes in open interest
The OIC FAQ explains three cases: both sides opening increases open interest; both closing decreases it; one opening and one closing leaves it unchanged. Each transaction still adds volume.
A complete fictional session
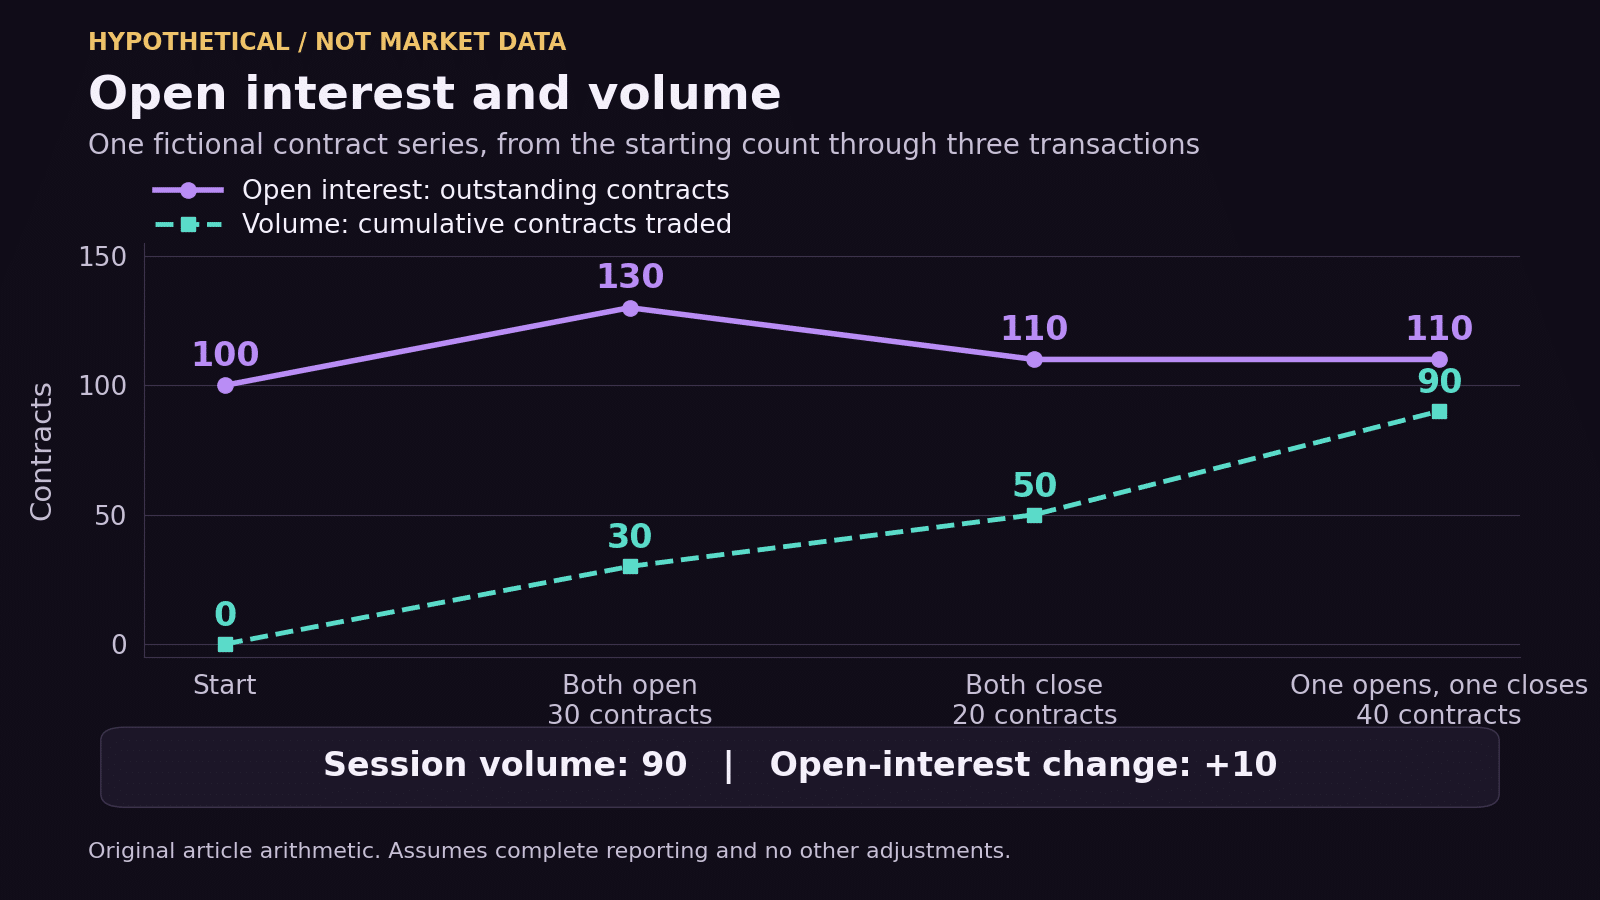
All quantities below are invented. Assume one contract series, starting open interest of 100 contracts, complete transaction reporting and no other adjustments:
- First, 30 contracts trade with both sides opening. Volume becomes 30 and open interest becomes 130.
- Next, 20 contracts trade with both sides closing. Cumulative volume becomes 50 and open interest becomes 110.
- Finally, 40 contracts trade with one side opening and the other closing. Cumulative volume becomes 90 and open interest stays 110.
The session therefore has volume of 90 contracts and an open-interest increase of 10. The calculation is 100 + 30 − 20 = 110. The 40-contract transfer contributes to activity without changing the outstanding total. This makes the difference visible without guessing who is optimistic or pessimistic.
If you saw only the final volume and open interest, you could not reconstruct those three groups uniquely. Other combinations could produce the same totals. Avoid presenting this illustrative sequence as a method for recovering hidden order details from public aggregates.
Check the change calculation
The fictional increase is 10 ÷ 100 × 100 = 10%, using starting open interest as the denominator. A source might display the absolute change, percentage change or both. Retain the baseline and do not describe an increase of 10 contracts as “10%” unless the calculation supports it. A percentage change from a zero baseline is undefined.
5. Keep the interpretation within the evidence
The OIC FAQ cautions that open interest alone establishes neither direction nor liquidity. Its count does not reveal participants’ wider positions or purposes.
Replace an unsupported story with a bounded observation. For the fictional session above, “volume was 90 and outstanding contracts rose from 100 to 110” is supported. “New informed buyers will push the price higher” adds participant identity, motivation and a forecast that the example does not establish.
When a community post combines these numbers with a news claim, verify the claim separately. Our guide to verifying market news gives a source-checking process. Repetition of a convincing explanation does not supply the missing contract identifiers or reporting times.
A short research record
- Question: What changed in this identified contract over this interval?
- Inputs: Source, contract, units, coverage, timestamps and original values.
- Calculation: Absolute change, denominator and any unit conversion.
- Observation: One sentence limited to what the checked inputs show.
- Unresolved: Missing reports, unmatched timing or explanations requiring further evidence.
You can keep these fields in the market research journal template. Preserve a screenshot or permitted export where useful, and append a correction if the source later changes. The goal is a comparison another reader can check.
Frequently asked questions about open interest vs volume
Can volume be greater than open interest?
Yes. An interval’s trading activity can exceed the outstanding count at a particular time. The fictional 1,200-to-600 comparison gives a ratio of 2.0, but the two figures have different time definitions. Keep those definitions visible before drawing any conclusion from the ratio.
Can open interest be high when today’s volume is low?
Yes. Existing outstanding contracts need not all trade during the selected session. A quiet interval therefore need not erase an earlier outstanding balance. First check that “today” refers to the source’s session and that the displayed open-interest value has the reporting date you expect.
Does open interest count buyers and sellers twice?
In the contract-count convention discussed here, each outstanding contract is counted once. A figure of 100 does not mean 100 bullish people, 100 accounts or 200 contracts. Read the publisher’s field definition if its report uses positions, sides or another counting convention.
Why might two websites show different open interest?
Compare the contract identifier, as-of time, unit, aggregation and revision status before deciding one is wrong. In the invented multiplier example, 750 contracts and 30,000 underlying units describe the same quantity. Keep both source records if the difference remains unresolved after these checks.
Is a rise in open interest automatically bullish?
No. A larger outstanding count alone does not reveal the market’s future direction. Write the observed change first, then identify what additional evidence supports any interpretation. A bullish label copied from a discussion should remain an attributed opinion rather than becoming part of the raw data.
Does unchanged open interest mean nothing traded?
No. In the fictional session, the final 40-contract transaction adds volume while leaving open interest unchanged. Different opening and closing activity can also offset in aggregate. An unchanged end value does not provide a complete account of what happened between two snapshots.
Should I add open interest across expiries?
Only when the combined scope answers your question and the units are compatible. Keep the individual expiry figures so changes within the total remain visible. Do not add an all-expiry total to its component months, and document any exclusions or specification differences.
Is a volume-to-open-interest ratio a trading signal?
This guide uses it only as a labelled arithmetic comparison. There is no universal threshold supplied here. A ratio needs a stated interval, an open-interest timestamp and a nonzero denominator; it does not by itself establish participant intent, liquidity or a future return.
Can I apply this directly to any “volume” field?
Check the definition first. A field might count shares, contracts, value or another form of activity. If the source does not identify what is counted, do not convert it into contract volume by assumption. Save the unknown unit as a limitation in your note.
What should I save when the data is incomplete?
Save the available values, source links, contract identifiers and known timestamps. Identify the missing field and the claim it prevents you from making. You can close a research entry as unresolved and review it when a suitable report becomes available, without filling gaps with estimates.

Source documentation checked 7 October 2026. All worked numbers are fictional educational examples. This article explains research methods and does not recommend a trade or promise an outcome.