

A trading order book is a structured record of buying and selling orders for a particular instrument and trading venue. A public display usually shows selected information from that record: prices, displayed quantities and sometimes individual anonymous orders. Reading it well starts with understanding what each row represents.
A row showing 900 shares at one price might combine nine orders, three orders or a single order. A reduction to 600 shares could reflect a trade, a cancellation or several offsetting changes. Those are different histories, even though the final screen can look identical.
This guide explains trading order book structure and reconstructs a small fictional book. It does not turn a large visible order into a prediction. Currency labels such as INR, PKR and USD identify the quotation; they do not establish which venue rules or trading permissions apply.
What a trading order book contains
The bid side contains buying interest; the offer or ask side contains selling interest. On a simple price-ordered display, the highest bid is nearest the top of the buying side and the lowest offer is nearest the top of the selling side. Some interfaces reverse the visual arrangement, so read the headings before interpreting colours or bar lengths.
Imagine a fictional share quoted in INR. The displayed bids are 300 shares at 499, 500 at 498 and 200 at 497. The offers are 400 shares at 501, 250 at 502 and 700 at 504. Each quantity belongs to its stated price and side. There is no offer at 503 in this deliberately complete example, but an omitted row in a real truncated feed would require a coverage check.
The last transaction might have occurred at 500. That historical trade does not add a fourth current bid or offer. A market-data screen can place last trade, order book and daily volume together while each field describes a different object. For the arithmetic connecting the best two quotes, use the separate bid–ask spread guide.
Also distinguish the public market book from an account’s “order book” tab. The latter may list only that account’s submitted, cancelled or completed orders. Identical menu names can refer to entirely different scopes.
A price level can contain several orders
Market-by-price data combines displayed quantity at a price. Market-by-order data provides individual-order detail where the feed supports it. CME Group’s explanation of these formats distinguishes aggregated price information from anonymous order identifiers and priority information. That is a product-specific example, not a guarantee that every vendor’s “Level 2” label supplies the same fields.
Return to the 400-share offer at INR 501. Suppose it comprises order A for 150 shares, order B for 100 and order C for 150. A price-level screen can show one row of 400. An order-level view can preserve the three pieces. Both views describe the same aggregate quantity, but only the second contains the partition needed for this queue exercise.
Even an order count would not recover the missing sizes. Three orders totalling 400 could instead be 20, 30 and 350. Those two queues respond differently to a 160-share execution under the same priority assumption. Aggregation deliberately discards information; a more elaborate calculation cannot restore it from the total alone.
The unit matters too. Four hundred shares, contracts and lots are not interchangeable. Record any lot multiplier independently of the visible quantity. Counting the rows tells you how many displayed entries you received, not how many people or beneficial owners stand behind them.
A worked queue example with explicit assumptions
For this classroom example, assume a simple first-in, first-out queue within each price and no hidden quantity, special priority or intervening messages. At INR 501, A arrived first with 150 shares, followed by B with 100 and C with 150. An incoming eligible buy executes 180 shares against this price.
- A supplies 150 shares and has zero remaining.
- B supplies 30 shares and has 70 remaining.
- C supplies none and retains 150.
- The displayed total at INR 501 becomes 220 shares.
If D then joins at the same price with 80 shares, the queue is B:70, C:150, D:80, totalling 300. Another 100-share execution would remove B’s remaining 70 and 30 from C, leaving C:120 and D:80. This example makes the order of events visible without assuming that every exchange uses this allocation method.
For a real India-market reference, NSE’s capital-market regulations specify price–time priority for the Normal market and explain that modification can retain or lose time priority under exchange parameters. Check the applicable market and current order rules before applying that description elsewhere.
A better-priced order belongs at another price level, so a queue position needs both a price and a priority definition. “Third in line” is incomplete if it ignores better prices or special allocation rules. A screen showing total quantity ahead also needs a clear explanation of how the provider inferred it.
For the separate distinction between an order’s price instruction and its actual fills, see our market order versus limit order guide.
Trading order book updates: less displayed quantity does not prove a trade
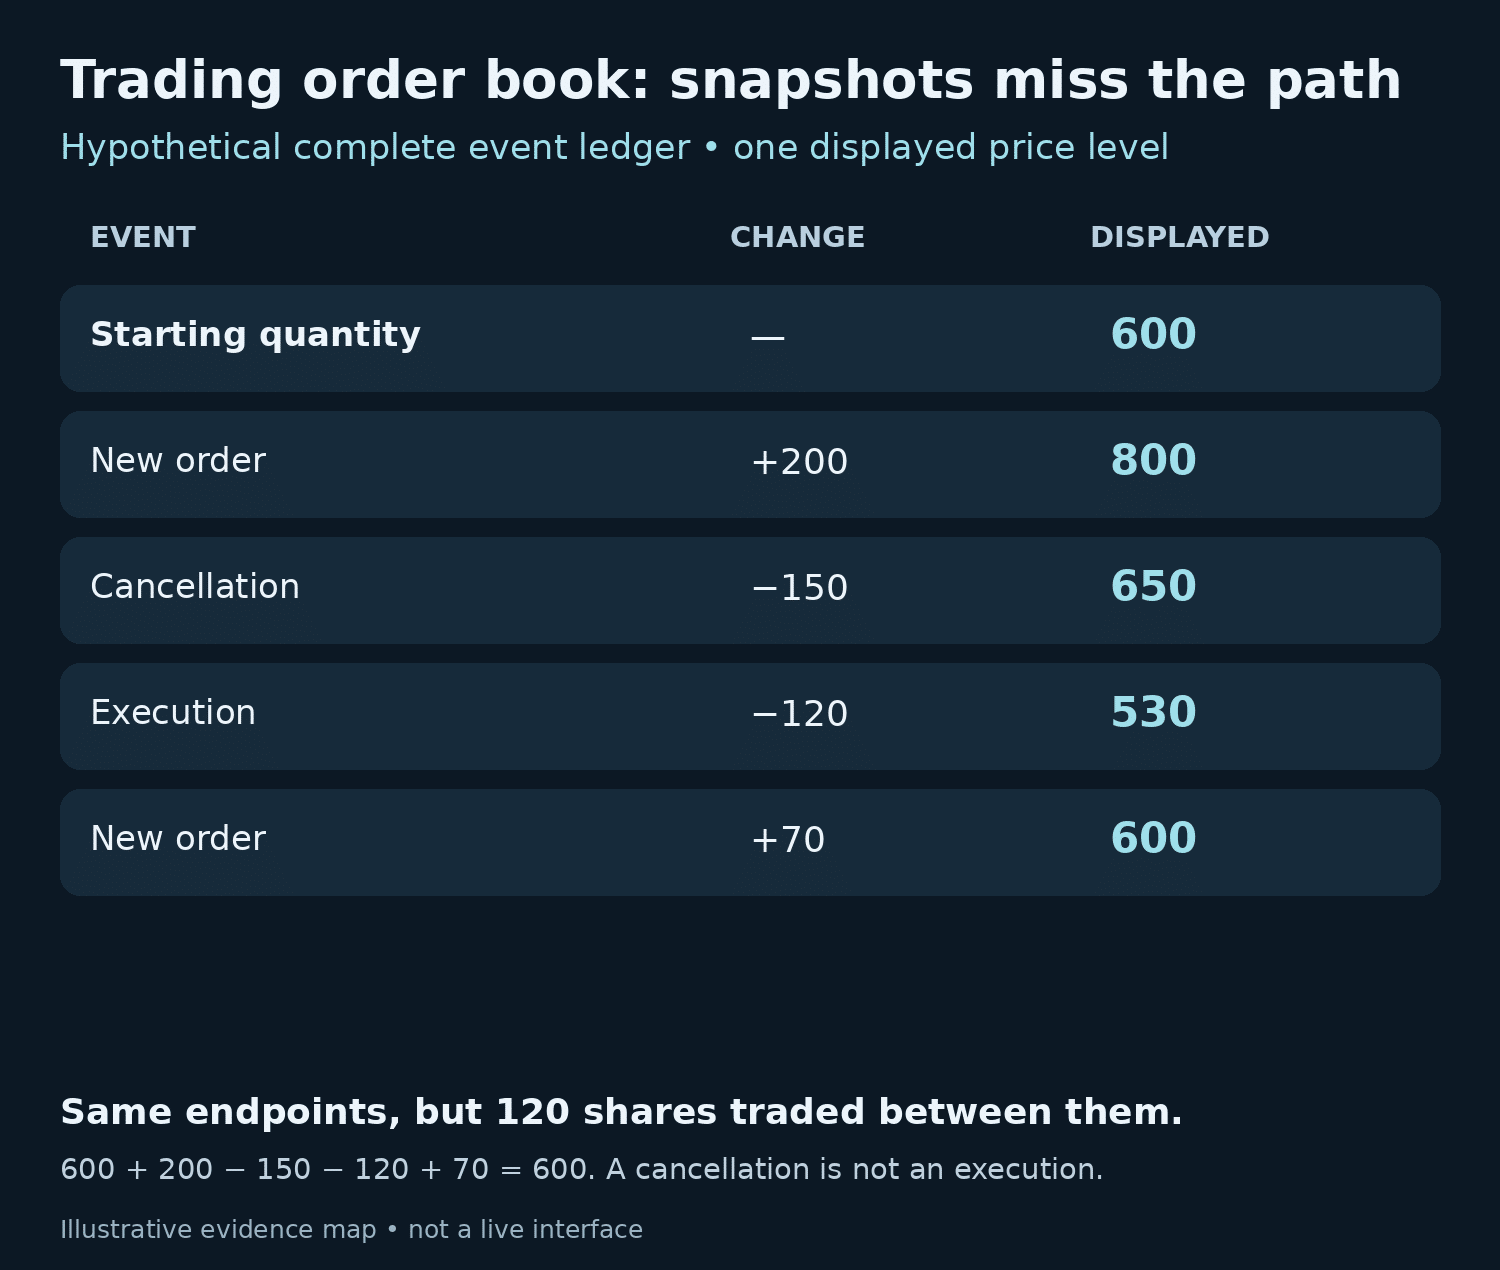
Consider a separate hypothetical level beginning with 600 displayed shares. The following complete event ledger changes it:
- A new order adds 200, taking the total to 800.
- A cancellation removes 150, taking it to 650.
- An execution removes 120, taking it to 530.
- Another new order adds 70, leaving 600.
The starting and ending snapshots both show 600. Nevertheless, 120 shares traded and 420 shares were added or cancelled. A statement that “nothing happened at this price” would miss the entire sequence. The reconciliation is 600 + 200 − 150 − 120 + 70 = 600.
Now suppose you observe only a decline from 600 to 480. One possible explanation is a 120-share trade. Another is a 120-share cancellation with no trade. A third combines additions, executions and cancellations that net to the same reduction. Without the relevant event messages or reconciled trade records, the cause is unresolved.
This is also why an animation of bars shrinking cannot, by itself, identify aggressive buyers or sellers. The display may compress several updates into one frame. A visually dramatic change can reflect aggregation, refresh frequency or a change in coverage as well as market activity.
When reconstructing a feed, treat its instructions literally. An update may replace a level’s quantity rather than add a quantity to it. Applying “set quantity to 530” as “add 530” creates an internally wrong book even if every message was received. Preserve sequence identifiers, reset events and snapshot boundaries when the source provides them.
Visible orders have important boundaries
A full-depth product can still be venue-specific and limited to displayed interest. Nasdaq’s depth-feed definitions identify the relevant Nasdaq market and displayed orders. “Full” describes the product’s defined coverage; it does not automatically combine every exchange, private transaction or undisclosed quantity.
Likewise, an order identifier is not a person’s identity. One participant may submit multiple orders, and public anonymous records usually cannot establish the underlying motivation. Ten visible entries do not prove ten independent opinions about a company’s value.
For an NSE example of partial visibility, its trading-system description explains disclosed-quantity orders and the separate handling of untriggered stop orders. A public regular-book view therefore should not be treated as a complete inventory of every contingent instruction.
Readers comparing India, Pakistan and US screenshots should preserve the exchange, segment, currency and session. A PSX screenshot quoted in PKR should be interpreted under its actual source specification, rather than inheriting the assumptions of the INR classroom queue above. Session transitions and auctions can also change what a book display represents.
A large “wall” is observed quantity at a time and price. Its presence does not prove support or resistance will hold; its disappearance does not establish deceptive intent. Such conclusions require additional evidence about orders and conduct. The separate liquidity versus volume article covers depth measurement and recovery without treating one snapshot as a market-wide guarantee.
Build a record another reader can check
For a useful screenshot or export, keep instrument identifier, venue, session state, source timestamp, receipt timestamp, currency and quantity units. Add whether rows represent orders or aggregated prices, how many levels are included, and whether the feed was live, delayed or interrupted.
If comparing two observations, record whether their price grouping matches. A vendor that buckets several prices together can create a larger-looking bar without any underlying order becoming larger. Check both the grouping interval and the available depth before attributing the difference to participant behaviour.
Finish with a narrow statement: “At the stated time, this venue displayed three offers totalling 1,350 shares across the shown prices.” Extend it to a claim about executions only when transaction evidence supports that extension. Save the source and uncertainty in a market research journal so later updates can be checked against the original observation.
Trading order book: frequently asked questions
1. Is an order book the same as a list of trades?
No. The book describes outstanding orders within its coverage. A trade record describes executions that have occurred. A quote can disappear through cancellation, so changes in the book cannot automatically be counted as completed trades.
2. What does market depth mean on the screen?
It usually refers to displayed quantities beyond the best prices, but the product definition matters. Check the number of levels, price grouping, units and venue before treating the panel as complete depth.
3. Does one row represent one trader?
Not necessarily. A price-level row can aggregate multiple orders, while multiple orders can belong to one participant. Anonymous public data generally cannot identify distinct beneficial owners or explain their intentions.
4. What is the difference between market by price and market by order?
The former aggregates at a price; the latter preserves individual-order detail within the feed’s rules. The distinction affects whether you can analyse order partitions and priority rather than only total displayed quantity.
5. Can an unchanged book contain substantial activity?
Yes. In the event example, additions, cancellation and a 120-share execution leave the total unchanged at 600. Endpoint snapshots reveal net state, while the complete ledger reveals what happened between them.
6. Does an order’s timestamp always determine its priority?
Only under applicable rules. Price usually matters first in a price–time example, and modifications or special order types can affect priority. Do not transfer one venue’s queue assumptions to every market.
7. Are stop orders always visible in ordinary market depth?
No. Their treatment depends on where they are held and the venue’s rules. NSE describes untriggered stops in a separate book. A normal displayed depth panel should not be assumed to include every conditional instruction.
8. Can I infer a cancellation from two screenshots?
A lower quantity permits several explanations. You need suitable event or order-status data to establish cancellation rather than execution, replacement or a mixture. The snapshots alone may leave the explanation unresolved.
9. Why can two providers show different books for the same share?
They may cover different venues, depths, sessions or aggregation intervals, or deliver updates at different times. Compare those specifications before concluding that one provider’s underlying market data is wrong.
10. What should I do with a sequence gap in recorded data?
Mark the reconstructed state as uncertain and follow the feed’s recovery procedure, typically involving a valid snapshot or replay. Continuing to apply later updates to an incomplete state can preserve a plausible-looking but incorrect book.
For information about the wider service, review the current CrowdSent membership information. This educational guide does not claim that membership provides exchange data feeds or order-execution services.
Primary-source documentation reviewed 25 October 2026.
Educational information only. Worked examples are hypothetical. This article does not provide investment, legal or tax advice.