

CrowdSent Blog Team · Market research basics
The bid ask spread is the difference between the ask price and the bid price in a quote. To read it usefully, identify the instrument, quote currency, displayed quantity and timestamp, then subtract bid from ask. A small-looking difference needs that context before it can support a meaningful comparison.
This guide offers five ways to read a quote, with fictional INR and PKR examples. It explains arithmetic and research checks rather than recommending orders. None of the examples is a live quote, a promise of an execution price or a benchmark for what every market should display.
1. Identify the sides of the bid ask spread
In a conventional two-sided stock quote, the bid is the highest displayed buying price and the ask, also called the offer, is the lowest displayed selling price within the quote’s scope. The US SEC’s Investor.gov definition of bid and ask explains these terms. Its US educational context does not establish the quoting rules of every exchange.
Read the labels rather than assuming the left number is always the bid. Retain the symbol and, for derivatives, the full contract identifier. A stock quote, an option premium and a currency-pair quote can use similar-looking numbers while pricing different things.
A fictional share quote
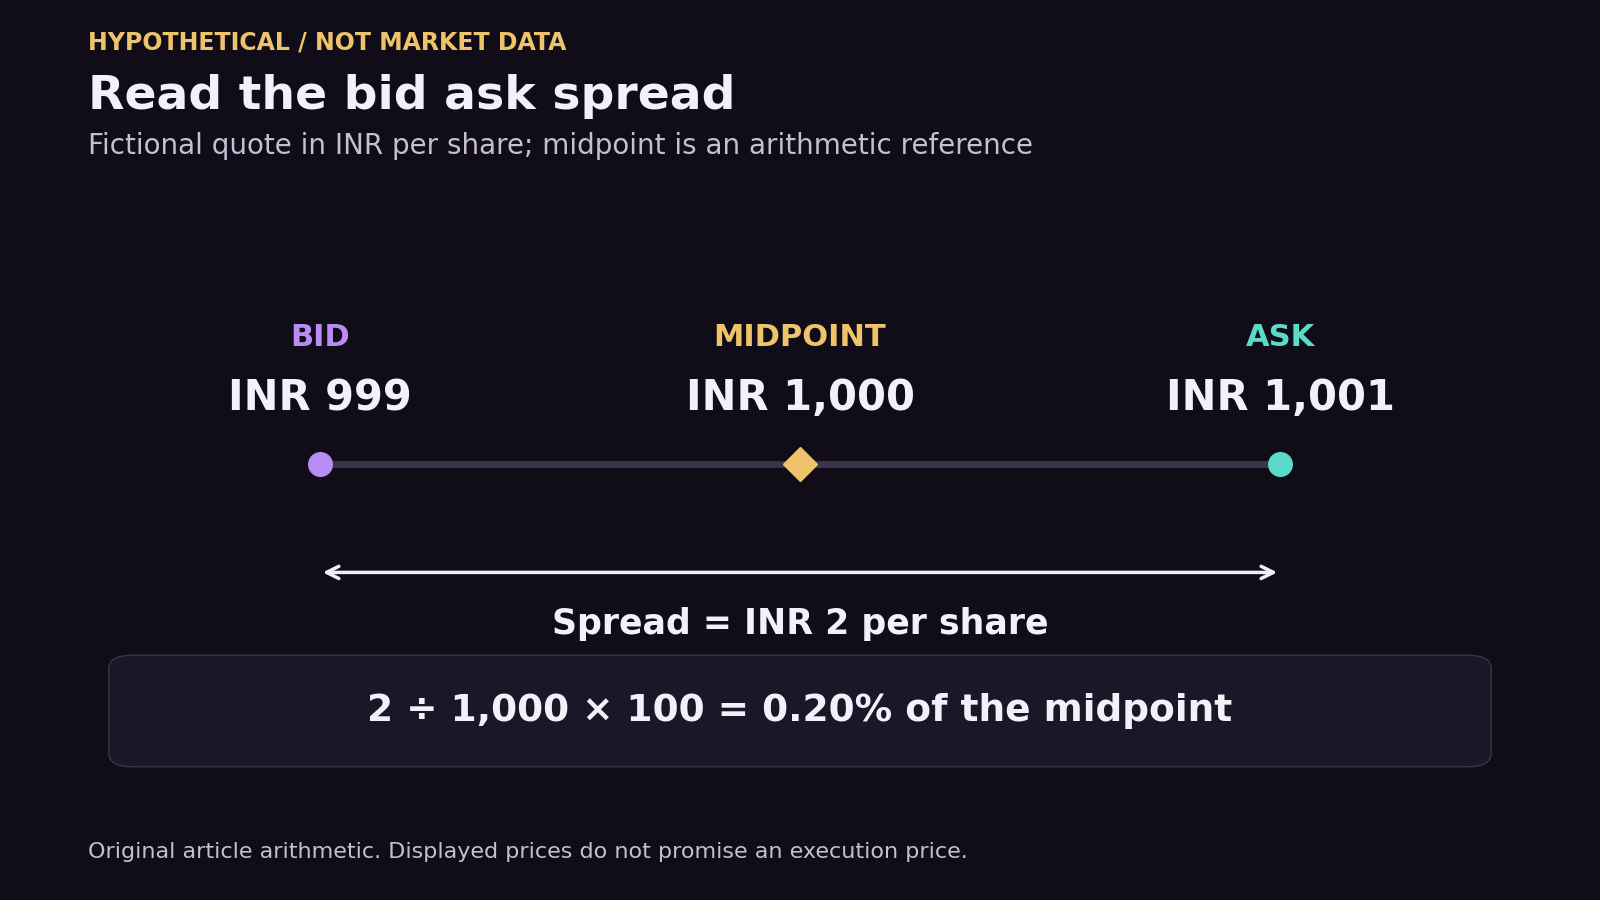
Suppose an invented share quote shows a bid of INR 999.00 and an ask of INR 1,001.00, both per share. Record those complete labels. The spread is INR 2.00 per share. “Two rupees” alone leaves out the currency and quantity basis, which matter when sharing the note with readers in India and Pakistan.
For a separate hypothetical currency-pair quote of 84.00/84.02 INR per USD, the difference is INR 0.02 per USD. It is not USD 0.02. This example supplies its own unit explicitly and makes no statement about a current exchange rate or an available currency product.
Use the publisher’s contract specification if the display is in points, lots or underlying units. Keep the original quote unit in your note before calculating a cash equivalent. An unexplained multiplier can turn correct subtraction into a misleading amount.
2. Calculate the difference, midpoint and percentage
For the fictional INR share quote, subtraction gives 1,001 − 999 = INR 2.00 per share. The midpoint is (1,001 + 999) ÷ 2 = INR 1,000.00. Dividing the spread by that midpoint and multiplying by 100 gives a midpoint-based spread of 0.20%.
The midpoint here is an arithmetic reference. It is not a valuation conclusion or a promised transaction price. Keep the formula visible when someone asks for “the percentage spread,” because using the bid or ask as the denominator produces a different result.
Why the denominator changes the answer
Consider a second invented quote: bid PKR 99.00 and ask PKR 101.00 per share. Its spread is PKR 2.00, midpoint PKR 100.00 and midpoint-based spread 2.00%. Dividing by the bid instead gives approximately 2.0202%; dividing by the ask gives approximately 1.9802%.
All three calculations can be described precisely, but they are not interchangeable. State which denominator you used and retain enough decimal places to reproduce the comparison. Rounding at the final step is usually clearer than rounding each intermediate value.
The two invented share quotes have the same numerical difference of 2 in different currencies, but different midpoint-based percentages. That does not rank the securities or compare their suitability. It simply shows why an absolute currency difference and a relative percentage answer different arithmetic questions.
Check before copying a formula
Confirm that the input cells contain numbers in the same currency and unit, with bid and ask taken from the same observation. If a side is missing or the midpoint is zero, mark the percentage unavailable. Do not let a blank field silently become a zero and create an apparently valid calculation.
3. Read the quantity beside the prices
The best displayed prices cover stated quantities. To assess a larger hypothetical amount, a researcher needs the relevant depth rather than only the top prices. NSE’s explanation of impact cost shows why order size and the outstanding order book matter. It treats impact cost as size-specific and dynamic, with separate calculations for buying and selling.
This is a useful distinction for research, without assuming that a saved order book will remain available. Treat a depth-based calculation as a scenario using stated inputs. Prices and quantities may change before any actual order reaches the market.
A fictional depth calculation
Assume an invented share book has a bid of INR 100.00 and a best ask of INR 100.20 for 40 shares. The next displayed ask is INR 100.50 for another 40 shares. Assume, only for this calculation, that both levels remain available and that 80 shares are bought across them.
- First level: 40 × INR 100.20 = INR 4,008.00.
- Second level: 40 × INR 100.50 = INR 4,020.00.
- Combined amount: INR 8,028.00 for 80 shares.
- Hypothetical average: INR 8,028.00 ÷ 80 = INR 100.35 per share.
The top-of-book spread is INR 0.20, while the scenario’s average buying price is INR 0.15 above the best ask. Those figures describe different comparisons. Calling the INR 0.15 difference “the spread” would lose the reference price and obscure the effect of the assumed size.
The scenario excludes fees, taxes, changes in the book and actual matching rules. It establishes an arithmetic result under its assumptions, not an amount someone can expect to pay.
4. Check the timestamp, venue and coverage
A quote needs a date and time. Retain the exchange or venue, the source, any delay label and whether you are viewing an active session, a saved snapshot or another display state. Your access time and the quote’s own timestamp belong in separate fields.
For a hypothetical snapshot at 08:00 UTC on 7 October, the equivalent clocks are 13:30 India Standard Time, UTC+05:30, and 13:00 Pakistan Standard Time, UTC+05:00. These conversions do not establish that a particular market is open. Verify the relevant session separately instead of importing a US timetable.
Compare like observations
If you are studying whether spreads changed, choose the instrument, source, sampling times and percentage formula before collecting the observations. Comparing one screenshot during a news release with another at an unrelated session time can leave several explanations for a difference.
Keep missing snapshots visible. An average of the observations you captured is an average of that sample, not automatically a time-weighted daily average. If one observation remains displayed for longer than another, an unweighted calculation gives both the same influence despite their different durations.
A useful note might say, “Three scheduled snapshots were collected; the fourth was unavailable.” It should not imply continuous monitoring. The window checks in our guide to reading historical sentiment also help when comparing sampled market observations.
5. Separate the quote from the conclusion
The SEC’s Trading Basics bulletin explains that a market order does not guarantee its execution price and that the last-traded price may differ from that price. A limit specifies a price boundary, but should not be read as a promise that the desired transaction will occur. Available order types and conditions require local verification.
For a research article or discussion, describe what the checked quote shows. “The midpoint-based spread in this snapshot is 0.20%” is a reproducible statement. Calling it “cheap,” “safe” or proof of a coming price move needs evidence beyond that calculation.
Keep a compact quote record
- Identity: Instrument, venue and complete contract details where relevant.
- Observation: Date, quote timestamp, timezone, source and delay label.
- Inputs: Bid, ask, displayed quantities, currency and price unit.
- Method: Absolute difference, midpoint, percentage denominator and rounding.
- Limits: Missing depth, incomplete coverage or assumptions in an illustrative calculation.
Use the market research journal template to preserve the record. If a discussion interprets a spread change as evidence of a news event, inspect its original claim separately; our guide to verifying market news can help with that step.
A screenshot can support a carefully bounded observation without settling the explanation. Record what you would need next, such as a verified timestamp or comparable earlier sample, rather than turning an incomplete quote into a confident forecast.
Frequently asked questions about the bid ask spread
Which price do I subtract?
Subtract bid from ask for the conventional quoted spread. In the invented INR 999.00/1,001.00 example, the answer is INR 2.00 per share. Check the labels first; reversing the inputs changes the sign and can conceal a simple transcription mistake.
Is the midpoint a price I can transact at?
The midpoint in this guide is the arithmetic average of two displayed prices. Its existence does not establish an available order at that price. Record it as a calculation and use actual execution records, if available, for claims about what a completed transaction received.
What is the percentage bid ask spread?
A clearly labelled version divides ask minus bid by the midpoint, then multiplies by 100. Other denominators produce different percentages. With the fictional PKR 99.00/101.00 quote, the midpoint-based result is 2.00%. Name the formula whenever you compare it with another source.
Is a smaller spread always better?
A smaller difference describes the two prices more closely spaced, under the chosen units or percentage formula. That alone does not assess the instrument’s risks or the depth available for a particular size. Keep a numerical comparison separate from a recommendation about the asset.
Does the displayed spread include brokerage and taxes?
The calculation here contains only ask and bid. No brokerage, tax, exchange charge or other separately charged amount enters it. For an all-in cost calculation, identify applicable charges independently and state their basis; do not label the quoted price difference as a complete cost estimate.
Why does displayed quantity matter?
It tells you the size associated with the displayed price in that source. Our fictional depth example produces an average of INR 100.35 when 80 shares span two assumed available ask levels. That result cannot be inferred from the best ask alone or promised for a future order.
Is the last-traded price one side of the quote?
It is a separate field describing a completed transaction, rather than automatically being the current bid or ask. Preserve its timestamp if your comparison uses it. A screen containing all three numbers still needs labels; proximity on the screen does not make the measures interchangeable.
What if the quote looks crossed or one side is missing?
If the displayed bid exceeds the ask, check the inputs, timestamps and source conventions before interpreting the result. If a side is missing, leave the spread unavailable. Neither condition justifies filling in a preferred price or assuming that a transaction opportunity exists.
Can I compare INR and PKR spreads directly?
Keep currency-denominated spreads separate unless you specify a conversion and its timestamp. A midpoint-based percentage removes the currency unit from that calculation, but it does not make different instruments, sizes or observation times equivalent. Preserve those differences beside any cross-market comparison.
How many snapshots establish a typical spread?
There is no universal sample count supplied here. Define what “typical” means for your question, choose a sampling method and report coverage. A few selected screenshots can illustrate those moments; calling them representative of a whole session requires additional support.

Source documentation checked 7 October 2026. All numerical quotes and depth examples are fictional. This educational article does not recommend orders, assess suitability or guarantee execution or investment results.