

CrowdSent Blog Team · Positioning-data literacy
Learning how to read a COT report starts with identifying the report family, contract market and observation date. The Commitments of Traders report groups reported futures positioning into defined categories. A category’s long or short total becomes meaningful only when you know which positions, traders and reporting period the table includes.
A common shortcut is to select one net-position number and call it market sentiment. That loses useful information about gross positions, the open-interest denominator and the age of the observation. This guide builds a more complete reading from the source record, using invented figures for every worked calculation.
The CFTC is a US regulator, and these reports have a specific reporting scope. Readers in India and Pakistan can study them as external market context without treating them as a census of local activity or the entire global spot market. No example below supplies a trade signal, recommended position or current positioning claim.
1. Learn how to read a COT report by identifying its scope
Use the CFTC’s COT report listings to locate the contract market and report family. Legacy reports divide reportable positions into commercial and non-commercial groups. Traders in Financial Futures uses Dealer/Intermediary, Asset Manager/Institutional, Leveraged Funds and Other Reportables. The Supplemental family covers selected agricultural contracts. These classification schemes should remain distinct in your notes.
Record the exact market name and contract market code, not only a commodity or currency nickname. Two rows can refer to related instruments while having different coverage. Also record whether you opened futures-only data or futures-and-options combined data, and whether the display is a short or long format.
Start with a question narrow enough for one dataset. “How did this category’s positions change between these two report dates?” is answerable. “What does everyone think about gold?” exceeds the scope of a contract-market table before any arithmetic begins.
Create a file name that contains the report family, market code and as-of date. Keep the original download alongside your calculation sheet. If a chart service renames a category, preserve both its display label and the underlying official field name so the mapping can be checked later.
Avoid choosing a category because its name sounds more informed or more directional. Classification describes a reporting framework. It does not establish that the group has one shared motive, complete information or a reliable forecast.
2. Keep trader classification separate from your interpretation
For physical-market research, the CFTC’s disaggregated explanatory notes identify Producer/Merchant/Processor/User, Swap Dealers, Managed Money and Other Reportables. Classification reflects the trader’s predominant activity, using reported information and CFTC judgement. A label therefore describes the assigned trader category; it does not explain the purpose of every individual position.
Keep the full label on first use. Shortening Producer/Merchant/Processor/User to “producers” discards parts of the category. Renaming Managed Money as “all speculators” expands it beyond what the label establishes. Such shortcuts can become especially misleading when multiple sources use different display names for superficially similar series.
Build a small field dictionary before comparing datasets. For each column, record the official name, units, report family and your chosen short label. Add a separate interpretation field if you want to note a possible economic explanation. That interpretation should not replace the category definition.
A category can contain positions associated with different businesses, time horizons and other exposures. The report alone does not reveal a complete portfolio. If a commentary claims to know why a category changed, identify the additional evidence supporting that explanation rather than deriving motives from the category name.
For a practical source check, use the market-news verification checklist on a positioning headline. Trace its number to the original row and ask whether its terminology matches the report it cites. A correct figure with an expanded or altered label can still communicate a false impression.
3. Read long, short, spreading and open interest carefully
The CFTC’s explanatory notes explain that total long and short open interest are equal across a market. Combined reports translate options into futures-equivalent positions using delta factors. Trader counts can overlap across columns; adding them need not give a distinct trader total.
For your selected category, copy the long and short columns separately before computing net positions. The usual arithmetic is longs minus shorts. A positive result describes a net-long balance within that category under those definitions; a negative result describes a net-short balance. Keep the sign convention in the column heading.
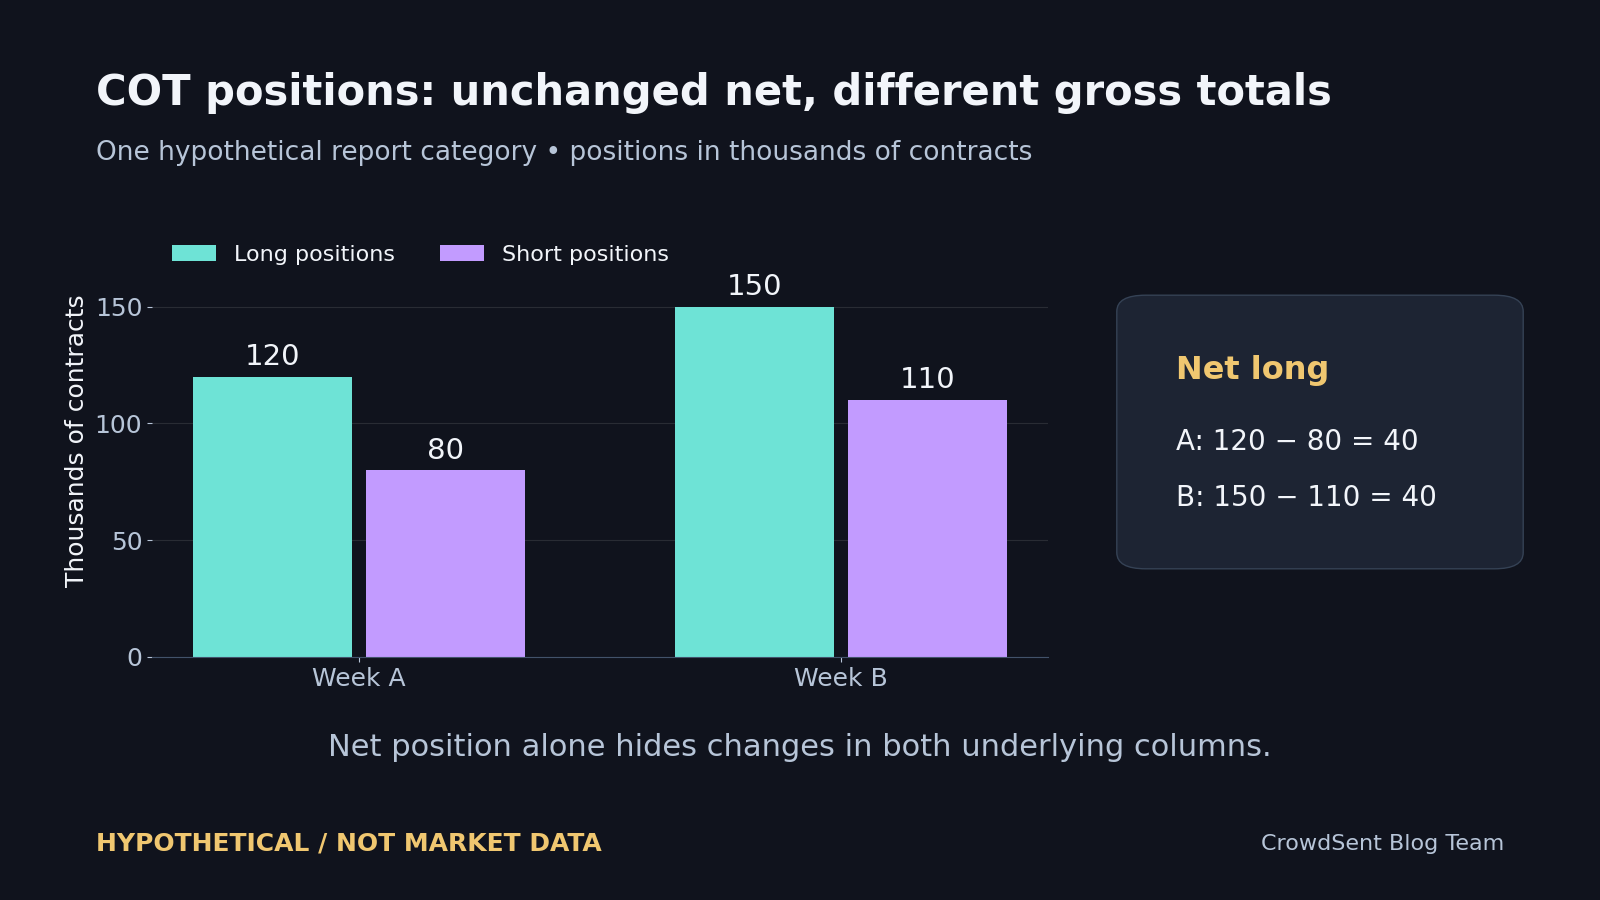
Hypothetical example: one fictional futures-only category, with spreading set to zero for this exercise, has 120,000 long contracts and 80,000 short contracts in Week A. Its calculated net position is positive 40,000 contracts. The report row does not become a record of 200,000 distinct traders or 200,000 transactions merely because the two position columns sum to that amount.
Hypothetical spreading example, specifically for a Legacy non-commercial futures-only row: a trader holds 900 long and 600 short contracts in one reported market. The row allocates 300 to long-only and 600 to spreading. To reconstruct each side, add spreading to long-only and to short-only: 300 plus 600 gives 900 longs; zero plus 600 gives 600 shorts. Spreading cancels when calculating net, leaving 300. Check other formats’ definitions separately.
When checking totals, reconcile each side against the format’s open-interest definitions, including any spreading and residual fields. Do not add the market’s total longs to its total shorts and call the result open interest. Preserve the downloaded columns even if your final chart displays only the derived net series.
The open interest vs volume guide distinguishes outstanding positions from trading activity.
4. Show gross changes and the denominator beside net positions
Continue the hypothetical example. In Week B, the category has 150,000 long contracts and 110,000 short contracts. Net longs remain 40,000. The long column increased by 30,000 and the short column increased by 30,000. A net-only chart would hide both changes.
That makes “positioning was unchanged” too broad a summary. A more accurate sentence is: “The calculated net balance was unchanged, while both reported long and short positions increased by 30,000 contracts.” This describes the available arithmetic without speculating about the cause or the identity of individual traders.
Now add the denominator. Suppose hypothetical total open interest was 400,000 in Week A and 500,000 in Week B. Net longs as a share of total open interest move from 10% to 8%, even though the net contract count is unchanged. Label this as your derived net/open-interest measure, not an unqualified official sentiment score.
The long share is 30% in both weeks: 120,000 divided by 400,000 and 150,000 divided by 500,000. The short share rises from 20% to 22%. These additional calculations reveal why a constant net count can coexist with a smaller net share of a larger market.
Use the same denominator definition on both dates. Mixing a futures-only numerator with a combined futures-and-options denominator creates a new, poorly defined statistic. If you intentionally construct a custom measure, explain the inputs and purpose rather than borrowing a familiar report label.
5. Distinguish the as-of date from the release date
The CFTC’s release schedule says reports are usually published on Friday at 3:30 p.m. Eastern time using the preceding Tuesday’s data, with holiday-related exceptions. Check the listed schedule and actual release. The as-of date describes the position snapshot; publication time describes when that snapshot became publicly available.
For historical research, use both fields. If a hypothetical Tuesday observation first appeared on Friday, an analysis of information available on Wednesday cannot use that Friday publication. Assigning the values to Tuesday in a chart may be appropriate for observation history, but it must not imply public availability on Tuesday.
The COT report lag also limits comparisons with a later market event. Suppose a fictional report covers Tuesday, a major event happens Thursday and the report is published Friday. The published table cannot establish how positions responded to Thursday’s event. Its observation predates that event, even though the publication came afterward.
Readers in India and Pakistan should convert the actual release timestamp with a date-aware time-zone reference. US Eastern offsets change seasonally; a late US release can fall on the next local calendar date. Save UTC and the local date rather than relying on a weekday label alone.
Check for corrected files or source notices when refreshing historical downloads. Preserve the retrieval date and the original copy. If a number changes, determine whether the report was corrected, your export filter changed or your own processing changed before describing the difference as new market activity.
6. Inspect concentration and the limits of coverage
The CFTC’s COT overview describes long-format concentration measures for the largest four and eight reportable traders, with gross and net variants. These are shares of open interest under the stated definition. Keep the long/short side and gross/net basis attached to each percentage.
Hypothetical concentration exercise: the largest four gross-long traders account for 35% of open interest and the largest eight account for 52%. Under a consistent ranking and denominator, the additional four account for 17 percentage points. This subtraction describes the reported distribution; it does not identify the traders or explain their behaviour.
Do not turn a concentration percentage into a headcount or a claim that those traders control the same fraction of all physical supply. The table’s measurement is narrower. Even a carefully calculated concentration statistic needs a clearly named market and date to remain interpretable.
The nonreportable residual also needs care. It is not a verified list of small retail accounts with known motives. Avoid relabelling it as “the public” or “ordinary investors.” If you need characteristics of those participants, the position residual itself does not provide them.
For an original coverage audit, write three lists: what the selected report directly measures, what related exposure it leaves outside that selected dataset and what your research question would additionally require. A currency-futures table should not quietly become evidence about every spot-currency transaction, and a metal-contract row should not become a full local jewellery-market survey.
7. Produce a reproducible positioning summary
Begin your summary with identity and time: report family, futures-only or combined scope, market code, as-of date and publication date. Follow with the long, short, net and open-interest figures you actually checked. End with a boundary statement that names the main question the data cannot settle.
For the fictional example, write: “In the selected category, longs and shorts each rose 30,000 contracts between the two snapshots. Net longs remained 40,000, while the derived net/open-interest share fell from 10% to 8% as total open interest increased. The data does not identify the intervening transaction sequence or a future price direction.”
Keep the calculations in a transparent worksheet: input columns first, formulas second, interpretations last. Test a deliberately simple row, such as equal long and short values, to confirm that your net formula returns zero. Test a negative result too, so formatting does not accidentally erase its sign.
If a historical sentiment comparison is part of the project, follow the guide to reading historical sentiment and align observation windows without treating different populations as identical. A community discussion sample and a COT trader category need separate definitions even when they refer to the same asset.
Use the market research journal template to save your field dictionary, original download, calculations and unresolved gaps. A useful stopping point is a checked description of the selected report. The research does not need a trade recommendation to be complete.
Frequently asked questions
Which COT report family should I use for a currency contract?
Look up the exact contract market in the official report listings and identify the available family and scope. Traders in Financial Futures provides a financial-market classification framework; other presentations may use Legacy categories. Choose according to the research question, and keep that choice consistent. Do not merge similarly named columns across families without a documented mapping.
Does “Managed Money” mean every speculative position?
It is a defined category in the disaggregated framework. Expanding it into a claim about every speculative motive would require information the label alone does not provide. Retain the official category name and examine the other columns separately. A useful summary states what that category reported without implying that the rest of the market shares its classification or purpose.
What does a net-long number hide?
It combines two inputs by subtraction. A net-long balance of 40,000 could arise from 120,000 longs and 80,000 shorts, or from 150,000 longs and 110,000 shorts in the hypothetical example. Keeping both columns reveals the difference. Open interest adds another useful denominator, but it should be matched to the same report scope and date.
Can I compare futures-only and combined figures directly?
Treat them as different series and preserve the scope in every chart label. Reconcile the field dictionary before making a comparison. For a practical check, download the same market and date in both formats and record which input columns differ. Switching series midway can create an apparent change caused by the dataset choice rather than the intended comparison.
Why does a Friday release describe Tuesday?
The report’s observation date and publication date serve different functions. The ordinary schedule reflects a Tuesday snapshot released later in the week, subject to exceptions. Use the snapshot date for describing positions and the verified publication timestamp for describing public information availability. Neither date should replace the other in a historical research record.
Can the report explain a market move between the snapshot and publication?
It cannot establish positions formed after its own observation date. For a fictional Thursday event following a Tuesday snapshot, the Friday publication still describes the earlier snapshot. Keep the event in a separate timeline and seek later evidence if needed. Publication after an event does not mean the report measured the event’s consequences.
Are nonreportable positions a retail sentiment survey?
The residual does not establish the identity, motives or account count of a surveyed retail population. Calling it a retail survey would add unsupported information. Describe the field using its report definition and identify any separate evidence needed for a question about particular investor groups. A convenient nickname should not replace an actual population description.
What does a concentration ratio tell me?
Read the full column heading and keep its ranking group, side and calculation basis beside the value. Then test a specific descriptive question, such as how the selected measure changed between two dates. The hypothetical 35%-and-52% example supports a 17-percentage-point difference; it does not identify firms, demonstrate coordination or explain a price movement.
Why might my calculated category percentages differ slightly from displayed values?
First check the denominator, report scope and whether all relevant columns were included. Then check rounding: calculations from full values can differ from arithmetic using already rounded percentages. Keep full precision internally and round the final display. If the difference is larger than rounding can explain, retain it as an unresolved reconciliation problem.
Can COT net positions be combined with an online long-short ratio?
Only after defining what each series measures, and any combined measure would need its own explanation. One may count positions within a regulated reporting category while another counts accounts or observations on a particular platform. Different populations and dates can coexist in a research note, but they should not be averaged as though they were equivalent votes.
Source documentation checked 7 October 2026. Educational research guidance from the CrowdSent Blog Team. All hypothetical examples are invented and are not current market data. This article does not provide investment recommendations.