

CrowdSent Blog Team · Research skills
A long short ratio compares a defined long measure with a defined short measure. Before comparing two readings, find out whether they count accounts, position size or something else. Then check whose activity is included, how opposing positions are handled and which period each reading describes.
A figure such as 1.5 can look precise while leaving those questions unanswered. This guide explains five checks that make the number interpretable, with fictional examples you can reproduce. It focuses on reading evidence, without turning a positioning statistic into a price forecast.
1. Check what the long short ratio counts
The basic calculation is the long measure divided by the short measure, using compatible units. A ratio above one means the numerator is larger. A ratio below one means the denominator is larger. That arithmetic does not identify what has been counted.
Bybit’s account-ratio documentation describes long and short holder shares and divides the long share by the short share. This is an example of a holder-based measure. Check the methodology behind the particular series you are reading instead of applying that definition to every similarly named chart.
A fictional account-count example
Suppose an invented sample contains 120 net-long accounts and 80 net-short accounts, with each account assigned to exactly one group. The long short account ratio is 120 divided by 80, or 1.5. The long share is 120 divided by 200, or 60%.
The ratio is 1.5, while the long share is 60%. Confusing the two would change the meaning of the observation. If the two groups fully cover the same sample, a ratio can be converted to a long share by dividing the ratio by one plus the ratio. Check those conditions before using the shortcut.
A fictional size-weighted example
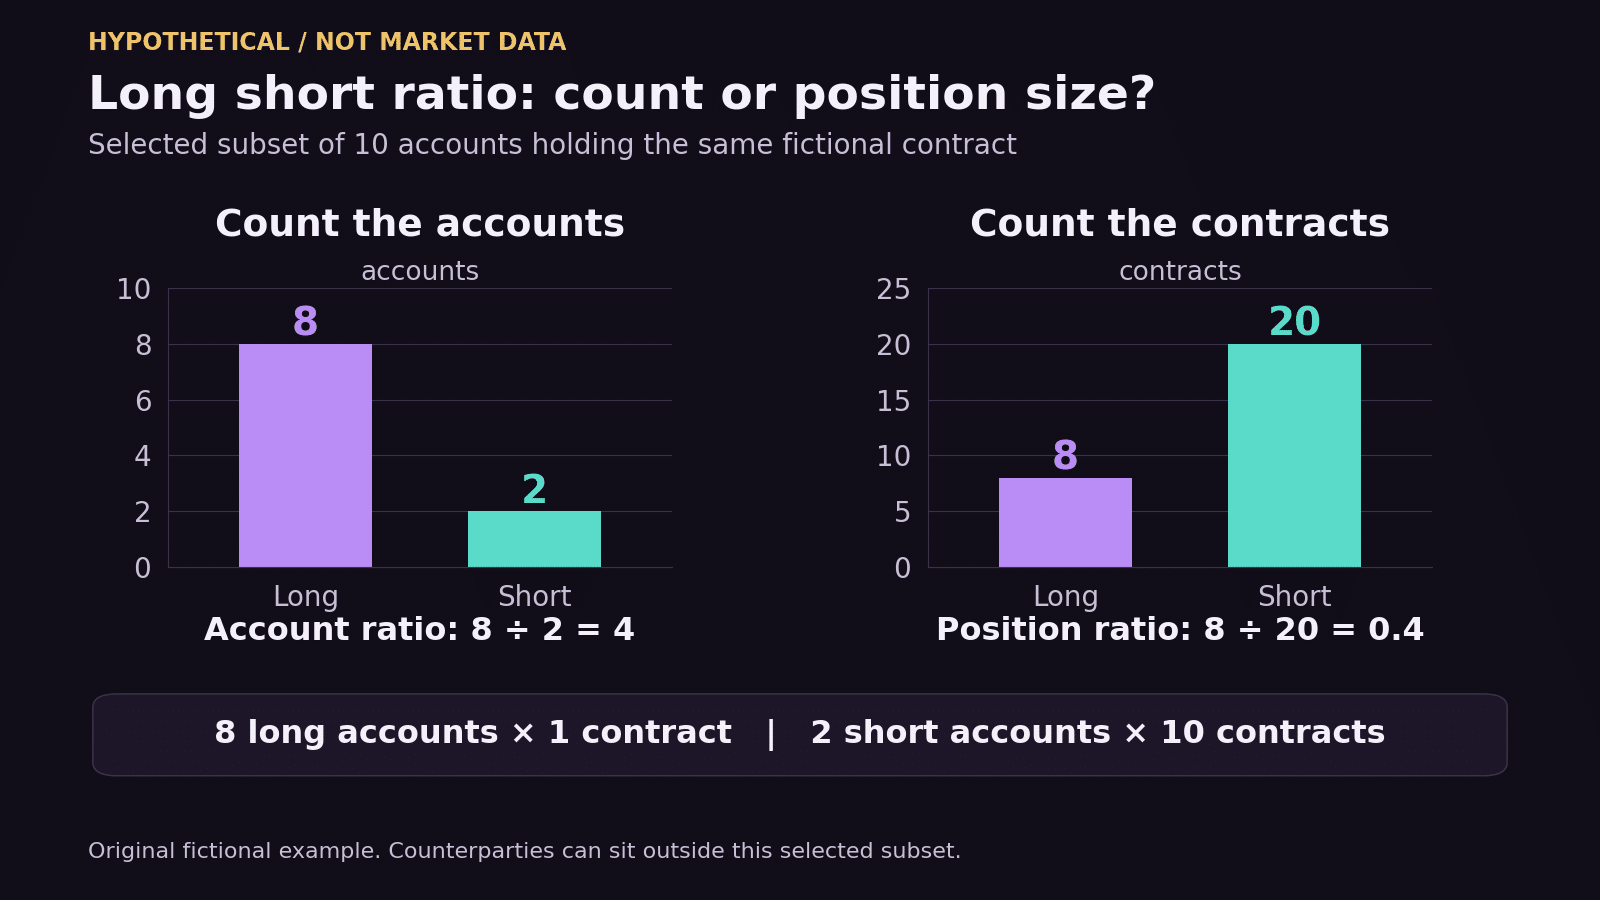
Now consider a selected subset of ten accounts holding the same fictional contract. Eight each hold one long contract, while two each hold ten short contracts. The account ratio is eight divided by two, or 4. The position-size ratio for this subset is eight divided by twenty, or 0.4.
Both calculations are correct under the stated rules. More accounts in the subset are long, while its short position size is larger. The counterparties outside this subset matter, as the third check explains. Always establish whether a size measure uses contracts, underlying-asset quantity or monetary value.
2. Check whose positions and which contract are included
A population is the set of accounts or positions eligible for a measure. A selected group, one venue and a broader collection can produce different answers. A label such as “global” still needs a definition of its boundaries.
Binance’s futures market-data documentation distinguishes a top-trader account ratio from a top-trader position ratio. Both refer to its top 20% of users ranked by margin balance; the account measure counts each account once. That ranking describes the selection rule. It does not establish that the selected users are the most profitable or that their positions predict prices.
Record the venue, exact symbol, product type, expiry if applicable, and settlement convention. Sharing an underlying asset does not make a perpetual contract and a dated future identical. A ratio for one instrument cannot describe every position involving that asset.
Keep the geographical scope honest
A reader in India or Pakistan may encounter a chart shared internationally. The reader’s location does not make the displayed accounts a local sample. Look for actual geographical coverage before describing a result as Indian, Pakistani or worldwide sentiment.
Similarly, an account count is not automatically a count of distinct people. Without a documented identity and aggregation rule, use the source’s term “accounts.” A change in the eligible population can also move the ratio even if continuing participants leave their positions unchanged.
3. Check netting and the matched-contract explanation
Netting combines opposing exposures within a defined scope. In a fictional same-contract example, an account with ten long units and seven short units has a net long exposure of three units. A gross measure retains both sides; a net measure subtracts one from the other.
Ask where that subtraction happens: within one contract, an account, a product family or another boundary. Also check the treatment of flat accounts and accounts holding both directions. If documentation does not specify a rule, mark it unknown rather than filling the gap with an assumption.
How can there be more longs if every contract has two sides?
For the same outstanding futures contract across the complete matched market, total long contract quantity equals total short contract quantity. CME Group’s glossary entry for open interest notes that each open transaction has a buyer and seller, while open interest counts one side. This accounting point does not require equal numbers of accounts on each side.
Imagine a complete fictional market with 90 accounts each long one contract and ten accounts each short nine contracts. There are 90 long contracts and 90 short contracts. The account ratio is 90 divided by ten, or 9; the contract-quantity ratio across the complete market is one.
A selected group can also have unequal position quantities because its counterparties can sit outside that group. Therefore, a long short position ratio away from one requires attention to the population and methodology. It cannot establish that unmatched long contracts exist across the complete market.
Finally, the visible position does not reveal every exposure held elsewhere. Treat an account’s classification as a description within the measured scope. Avoid translating it directly into the person’s overall belief, confidence or financial situation.
4. Align the period, timestamp and delivery time
Two readings labelled “one hour” may still need different interpretation. Check whether the value is a snapshot, an average across observations or another summary. Establish whether the timestamp marks the start or end of the interval and whether the latest interval is complete.
Separate observation time from the time you loaded the page. Bybit’s documentation warns that its interface can experience increased latency or temporary delivery delays during extreme volatility. A newly refreshed screen therefore needs a fresh timestamp check before you describe its reading as current.
Keep one reference timezone for comparison and add local time when useful. A hypothetical observation at 12:00 UTC corresponds to 17:30 in India and 17:00 in Pakistan. Those are the same instant. Two screenshots labelled only “5 pm” would need clarification before comparison.
Do not silently average incompatible ratios
Consider two fictional, non-overlapping account samples measured under identical rules: sample A has 90 long and ten short accounts, while sample B has ten long and 90 short accounts. Their ratios are 9 and about 0.111. The simple average of those ratios is about 4.556.
Pooling the underlying counts instead gives 100 long and 100 short accounts, a ratio of one. The calculations answer different questions. If samples overlap, even pooling counts needs a duplication check. Preserve the components and explain the intended aggregation.
Our guide to reading historical sentiment expands on matching windows and checking changes in sample composition.
5. Write a conclusion the evidence supports
A useful research sentence names the series, scope and observation. For the first fictional example: “Among the 200 included accounts, 120 were classified net long and 80 net short, producing an account ratio of 1.5.” Keep unknown position sizes visible.
Positioning and expressed opinion are different observations. A discussion can sound optimistic without revealing participants’ holdings. A holdings classification can exist without a public explanation of motive. Read what a sentiment score means and how to evaluate trading community discussions before combining those forms of evidence.
Read the labels in an L/S display
The archived CrowdSent illustration below shows “All Markets” and “1H” selected, with L and S percentages on market cards. Those visible labels alone do not establish whether the percentages count accounts or weight position size. They also leave the underlying source population and netting methodology unresolved.
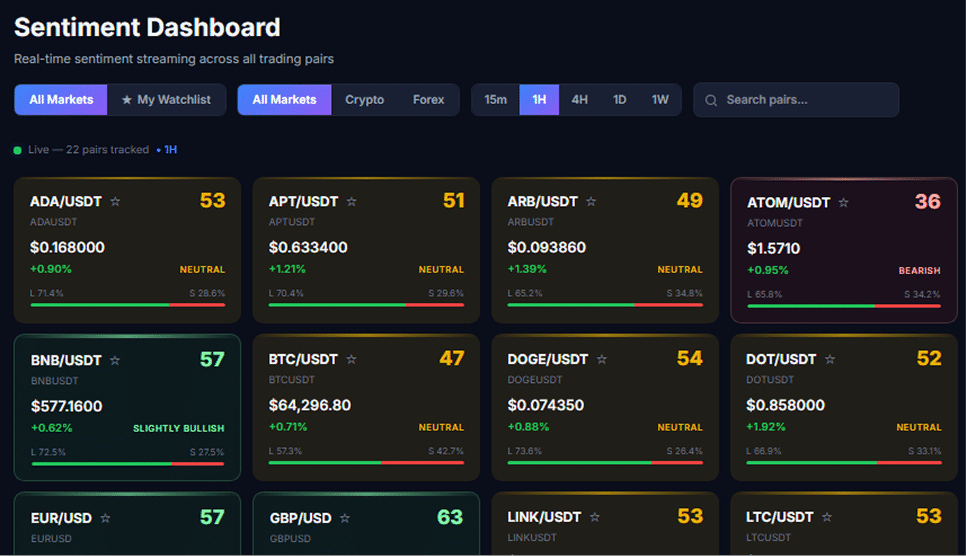
Use such a display as a starting point for questions: what does each side measure, which observations are included and when were they recorded? The archived image cannot establish a current market view, and its percentages should not be treated as verified exchange-account measurements.
Keep a compact comparison record
- Series: source, methodology link and exact metric label.
- Scope: instrument, eligible population and exclusions.
- Calculation: numerator, denominator, units and netting rule.
- Time: observation period, timestamp convention, timezone and access time.
- Limit: missing counts, delayed data, unknown rules or changed coverage.
- Conclusion: what differs and whether the comparison is like-for-like.
Use our market research journal template to preserve that record. If a key definition is missing, the defensible result may be “not comparable yet.” Naming the missing information is useful progress.
Frequently asked questions about the long short ratio
What is the simplest long short ratio meaning?
It is a specified long measure divided by a specified short measure. Finish the definition by naming the unit, population and time. “1.5 long accounts per short account in this sample” tells a reader considerably more than an unlabelled value of 1.5.
Does a ratio of two mean 200% of accounts are long?
No. In an exhaustive two-group account sample, it means two long accounts for each short account. The long share would be two out of three, about 66.7%. If the source includes other categories or uses different denominators, check its formula before converting.
Does a ratio above one mean the price will rise?
The arithmetic establishes that the measured long side is larger. A future price outcome requires evidence beyond that comparison. Even a historical association needs clear dates, consistent definitions and an appropriate test; a single reading cannot establish predictive reliability.
Why can account and position ratios point in different directions?
Account counting gives each included account the stated counting treatment. Size weighting gives larger positions more influence. The fictional ten-account example shows how many small longs can coexist with fewer larger shorts inside a subset. Neither result should be substituted for the other.
Can a rising ratio happen without additional long accounts?
Yes. In a fictional count measure, 60 long accounts divided by 40 short accounts gives 1.5. If the long count stays at 60 and the short count falls to 30, the ratio becomes two. Inspect both components before describing what caused the increase.
What if the short denominator is zero?
Ordinary division by zero is undefined. A provider may return an empty field, a special value or another display treatment. Check that rule and retain the underlying counts if available. A missing reading and a genuinely zero denominator should not be treated as equivalent.
Is one a universally neutral reading?
One means equality between the numerator and denominator under that measure. It does not establish equal conviction, leverage or risk. Nor does it tell you whether one is typical for the chosen series. Any historical comparison still needs consistent scope and methodology.
Can I compare two venues directly?
First compare their definitions, eligible populations, instruments and timestamps. Even when those align, the observations describe separate samples. If they disagree, report the difference with its scope rather than choosing whichever number supports an existing explanation or calling one automatically wrong.
Can a social-media screenshot establish a sudden change?
Only if you can establish the source, metric, filters and observation times needed for the comparison. A cropped image often removes those details. Find the underlying series where possible and keep an unresolved label if you cannot reconstruct what was displayed.
Does CrowdSent provide the exchange measures described here?
This article explains how to examine externally documented measures. It does not establish that CrowdSent supplies those exchange feeds or duplicates their methodologies. Check current product details for features you need, and keep each external observation linked to its own source.

Source documentation checked 7 October 2026. All numerical scenarios are fictional educational examples, not current market readings or investment recommendations. Source links document definitions and do not imply provider endorsement or regional availability.