
CrowdSent Blog Team · Published 6 October 2026 · Research skills
A sentiment score is a number that summarizes a defined aspect of sentiment. Depending on the system, it may describe the positive or negative tone of text, confidence in a sentiment label, or a summary across many observations.
The useful first question is simple: what does this particular number measure? A value of 0.8 can carry very different meanings on two screens. Understanding the scale, the underlying material and the evidence behind the label helps you read it accurately.
In this guide, we work through five interpretation checks, using fictional examples you can follow without knowing a platform’s formula. The aim is a clear research conclusion that stays within what the evidence supports.
1. What does the sentiment score measure?
Find the sentiment score’s definition before interpreting its size. Note the minimum and maximum, the meaning of zero, and whether the value describes a sentence, a document, a subject within a document or a collection. A familiar sentiment score label does not guarantee a familiar calculation.
Sentiment polarity: the direction of the language
Sentiment polarity describes where language sits between negative and positive. For a documented example, Google Cloud Natural Language uses a score from −1 to +1 for emotional direction. Its document-level magnitude is a separate, nonnegative, unbounded measure of emotional content; longer documents can have larger magnitudes. A near-zero score can reflect little emotion or offsetting positive and negative language. These are Google’s definitions, rather than a universal scoring standard.
Hypothetical example: A fictional tool documents a polarity scale from −1 to +1 and shows +0.8. You can describe that result as being toward the positive end of its scale. You still need the tool’s guidance before assigning a label such as “strongly positive,” because the category boundaries have not been supplied.
Sentiment confidence: confidence in a category
Some systems answer a classification question. Amazon Comprehend returns a sentiment label and scores for positive, negative, neutral and mixed. AWS describes each score as the likelihood that the sentiment was correctly detected. This is a different definition from a position on a negative-to-positive scale.
Hypothetical example: Another fictional tool shows 0.8 beside “positive-classification confidence.” That field concerns the category assignment. It does not tell you how enthusiastically the writer expressed the opinion. A clear, mildly favorable sentence could be easy to classify, while an emotionally intense but ambiguous passage could be harder.
Neither fictional 0.8 reading establishes an 80% chance that a market price will rise. A price forecast would need a defined outcome, a time horizon and separate evidence testing that prediction. These examples are invented for explanation; they are not API responses or CrowdSent measurements.
Sentiment magnitude: the amount of emotional content
When magnitude is available, read its documentation separately. In Google’s example above, document magnitude can help distinguish a low-emotion passage from one containing substantial positive and negative language. It is not a percentage or a classification-confidence score.
Imagine two fictional notes: “The update was published on Tuesday,” and “I love the clearer reporting, but I am furious about the missing detail.” The second contains opposed emotional reactions; the first mainly conveys information. They deserve different descriptions even if a summary view places both near its midpoint. We have not assigned either note an actual model output.
Google and AWS are terminology examples here. This guide does not establish that CrowdSent uses either service or follows either provider’s calculation method.
2. Whose language and which subject were measured?
Before calling a reading “market sentiment,” identify the material behind it. A selection of headlines, a collection of comments and a set of company statements represent different kinds of evidence. A sentiment score based on many items still needs a clear description of how those items were selected.
Start with the unit being scored. Is one observation a sentence, an entire article, an author, or a mention of a particular company? Then check which entity the sentiment refers to. The overall tone of an article can differ from the tone of a single quotation inside it.
Hypothetical example: A report says, “Customers welcomed the new service, while suppliers criticized the contract changes.” An overall label leaves an important question open: are you researching customer reactions, supplier reactions or the report as a whole? Reading the subject alongside the language prevents those viewpoints from being collapsed into one claim.
A useful source description records:
- Material: What types of text were included, and what was excluded?
- Subject: Which entity, event or topic was the analysis intended to describe?
- Coverage: Which languages, sources and collection period were represented?
- Unit: What counted as one observation, and how many were available?
If you cannot answer one of these questions, write “not disclosed” or “not checked” beside it. Keep those two states distinct: information may exist even if you have not reviewed it yet. This is more useful than assuming a dashboard covers the whole conversation.
3. What does the overall number hide?
An aggregate sentiment score compresses a collection. To understand that compression, ask for the distribution where it is available: how many observations fell into each category, how much values varied and whether a few items dominated the summary.
A midpoint can conceal disagreement
Hypothetical arithmetic example: Imagine two sets of ten manually assigned values on a fictional −1-to-+1 scale. Set A contains ten zeros. Set B contains five values of +1 and five of −1. An equally weighted arithmetic mean is zero for both sets.
The first set has no variation in its assigned values; the second contains opposing extremes. Reporting only the mean sentiment score discards that distinction. This calculation illustrates a property of averaging, not a formula for CrowdSent or either provider. Do not assume a real dashboard uses an arithmetic mean unless its documentation says so.
Neutral items change the denominator
Hypothetical category example: A researcher manually groups 100 fictional items into 30 positive, 10 negative and 60 neutral, with no mixed items in this example. Positive items are 30% of the full collection. They are 75% of the 40 items classified as either positive or negative.
Both percentages follow from the same counts, but they describe different denominators. “75% positive” would be incomplete without explaining the exclusion of neutral items. Whenever you see a percentage, ask “a percentage of what?” and look for the categories left out.
Also distinguish a mixed document from a mixed collection. One document may contain opposing views, while a collection may contain separate positive and negative documents. Check whether “mixed” names an individual classification, a description of the overall distribution or something else in the interface.
Repeated stories can outweigh distinct accounts
Hypothetical deduplication example: Twelve collected links include ten exact republications of one positive article and two distinct negative articles. Counting links produces ten positive observations out of twelve, about 83%. Grouping the exact copies into one article produces one positive article out of three, about 33%.
This example makes the counting choice visible. It does not establish that either count answers every research question. Copies might matter when studying circulation, while distinct texts might better fit a question about the range of arguments. Two separately written articles may also rely on the same announcement, so removing exact duplicates does not prove independent evidence.
For an aggregate sentiment score, ask how repeats are identified, whether sources receive different weights, and what the reported count represents. If the rule is unavailable, describe the limitation instead of trying to reverse-engineer a formula from the final number.
4. How much confidence does the evidence deserve?
Keep three questions separate when assessing sentiment score reliability. Was the language classified appropriately? Are the underlying factual claims supported? Does the collection represent the discussion you meant to examine? A strong answer to one does not settle the others.
Review the classification in context
Read a few underlying examples if they are accessible, including borderline cases and items that seem to contradict the aggregate. Look for quoted speech, negation, humor and changes of subject. These are useful things to inspect; their presence alone does not prove that a model made an error.
Hypothetical example: “Great, another service outage” uses a positive word in a potentially critical sentence. A reviewer needs the surrounding context before deciding whether the writer is pleased, sarcastic or quoting someone else. A keyword by itself would leave that unresolved.
For a broader reliability claim, look for evaluation evidence relevant to the language and kind of material you are using. Ask how the reference labels were checked and what kinds of mistakes occurred. Where confidence values are reported, look for testing of how those values relate to observed classification errors. Extra decimal places provide no substitute for that evidence.
A fictional evaluation: what can a headline accuracy figure hide?
A provider may report evaluation results alongside a sentiment score. Read what was tested before treating a headline accuracy figure as evidence that every category works equally well. The following arithmetic example shows why the category breakdown matters.
Imagine 100 invented sentences that human reviewers have labelled for a teaching exercise: 80 neutral and 20 positive, with no negative or mixed examples. A fictional system labels every sentence neutral. It agrees with the reference label on 80 of 100 sentences, giving 80% overall agreement. Yet it identifies none of the 20 positive sentences.
The overall figure is arithmetically correct. It answers a broad counting question while hiding a serious limitation for someone interested in positive language. This is an invented evaluation, not a test of CrowdSent, Google or Amazon. It also says nothing about categories that the sample does not contain.
Next, imagine a second fictional system marks 16 of the 20 reference-positive sentences positive, misses four, and incorrectly marks eight of the 80 reference-neutral sentences positive. It finds 16 of 20 positive examples, or 80%. Of the 24 sentences it calls positive, 16 match the reference label, or about 67%.
Those two percentages use different denominators. The first asks how many reference-positive examples were found. The second asks how many positive classifications matched the reference. Both help explain the result more clearly than a single overall number. Neither is a prediction about market prices.
When reviewing evaluation evidence, ask which kinds of text, languages and categories were included, how the reference labels were decided, and whether the test material resembles your own use. A small set of easy examples cannot establish performance on every kind of financial discussion. Disagreement among reviewers is also worth recording rather than hiding behind a precise final percentage.
Classification confidence adds another question: do similar confidence values correspond to similar observed error rates on relevant held-out material? The two counting examples above cannot answer that. They did not include any per-sentence confidence values. Keep this missing test explicit rather than interpreting the 80% agreement figure as proof that an individual 0.8 confidence value is reliable.
Also ask whether the evaluation examples were separate from material used to tune the system. Repeatedly changing a method after inspecting the same test examples can make its reported results less informative about new material. If that separation is not documented, record the limitation. An evaluation should explain its procedure, not just display an impressive number beside the sentiment score.
For a practical note, record the evaluation source, category counts, reference-label method and relevant limitations. If a provider supplies only a headline result, preserve its stated scope and mark the missing breakdown. You can still describe what a sentiment score measures while leaving its reliability on your particular material unresolved.
Check the claim behind the tone
An enthusiastic article may accurately convey its author’s enthusiasm while repeating an unsupported claim. To assess the claim, trace it to an original announcement, filing or other appropriate primary evidence. Our guide to verifying market news walks through that separate task.
Keep the two findings in your notes. For example, “The wording is favorable; the reported figure has not been verified.” That statement preserves the useful language observation without treating it as factual confirmation. A confidently assigned sentiment label cannot perform the missing verification step.
5. What conclusion can you support?
Turn your sentiment score checks into a short statement with three parts: what was measured, what the result describes and what remains uncertain. Use the platform’s documented sentiment score terms where available. Avoid upgrading “positive language in this collection” into a claim about everyone’s beliefs, market positioning or future returns.
Hypothetical research note: “In our fictional collection of 100 manually grouped items, 30 were positive, 10 negative and 60 neutral. Positive items outnumbered negative items, while neutral items were the largest category. We have not established whether this selection represents the broader discussion.”
That note gives the reader enough information to check the interpretation. If a real view supplies only an aggregate value, record that value and its documented definition, then say which breakdowns were unavailable. Do not invent missing counts to make the explanation feel complete.
When the research question shifts to changes across dates, use our guide to reading historical sentiment for timeframe and observation-window checks. First establish what the measure means; then investigate how it changes.
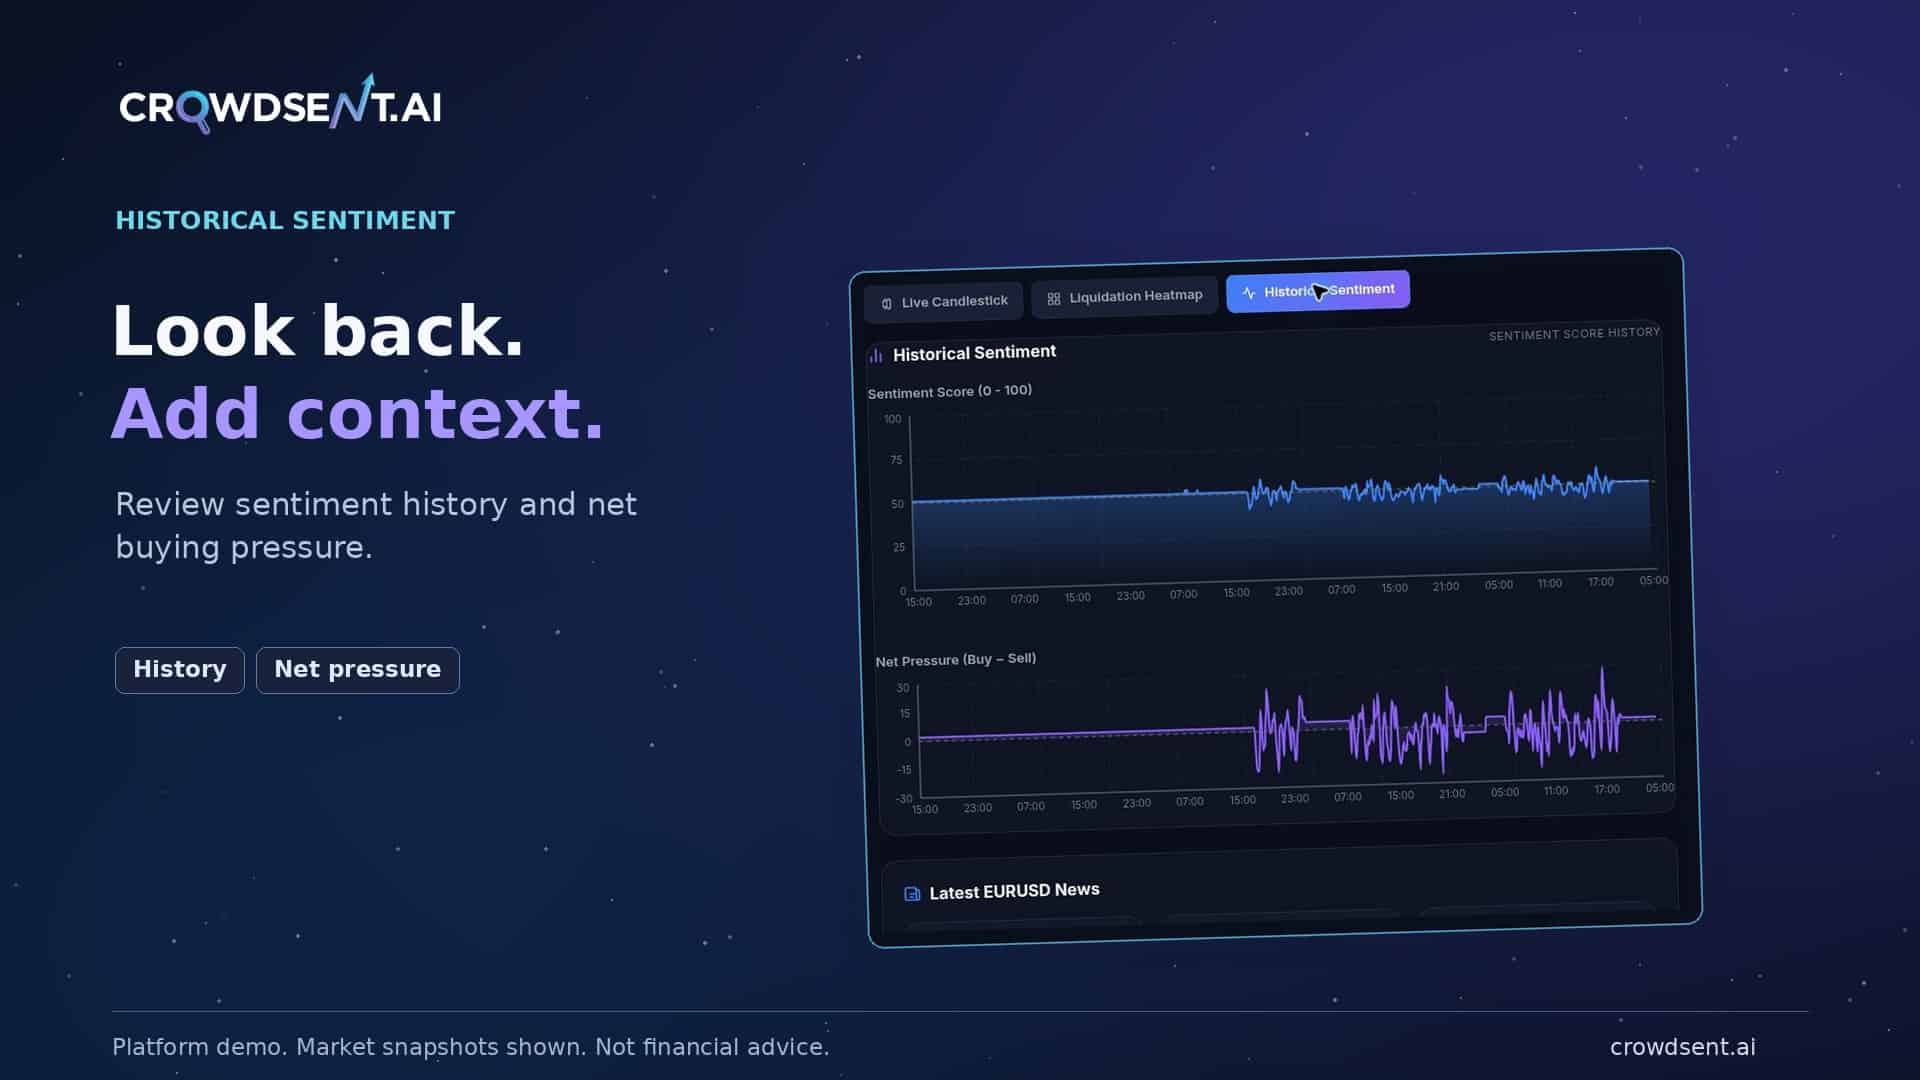
The demo puts different measures on one screen. Read each field according to its own definition before combining them into an explanation. The screenshot alone does not document either calculation or establish a relationship between them.
A practical sentiment score checklist
Before saving or sharing an interpretation, check that your note contains the details needed to review it:
- Definition: Exact field name, scale and meaning of the endpoints.
- Measure: Polarity, classification confidence, magnitude or another documented quantity.
- Scope: Subject, source types, language, collection period and observation count, where available.
- Breakdown: Category counts or variation, including neutral and mixed observations.
- Counting rules: Denominator, duplicate handling and any documented weighting.
- Evidence: Examples reviewed, evaluation information checked and factual claims still needing verification.
- Conclusion: One supported finding and the most important unresolved limitation.
You do not need every field to make a useful observation. You do need to show which details you know and how the missing ones limit the interpretation. That habit makes a sentiment score easier to discuss, question and revisit.
Frequently asked questions about sentiment scores
What does a sentiment score of 0.8 mean?
On a documented −1-to-+1 polarity scale, +0.8 is on the positive side. In a confidence field, 0.8 answers a classification question. Read the definition, endpoints and scored unit first; neither interpretation automatically describes a price-rise probability.
How is polarity different from classification confidence?
Polarity concerns the direction of the language. Classification confidence concerns the assigned category: Amazon Comprehend’s documentation describes scores for positive, negative, neutral and mixed classifications. A clearly worded but mildly favorable statement can be easier to classify than an emotionally intense, ambiguous one.
What does sentiment magnitude measure?
In Google Cloud Natural Language’s documentation, document-level magnitude describes emotional content and has no fixed upper bound. Longer documents can have larger values. That provider-specific definition does not establish CrowdSent’s method, and magnitude should not be read as a percentage or classification-confidence value.
Does a value near zero always mean neutral language?
No. Under Google’s documented polarity definition, a near-zero value can reflect little emotion or offsetting positive and negative language. For a collection, inspect the available distribution as well. An overall midpoint cannot tell you whether individual observations agree or point in opposing directions.
Why does the denominator matter in a positive percentage?
Check which items count toward the total. Thirty positive items among one hundred items equal 30%; if only forty are positive or negative, those same thirty equal 75% of that subset. Both calculations are valid, but omitting the denominator changes what readers understand.
How can repeated articles affect an aggregate reading?
Repeated material can receive more influence when each copy counts as an observation. Check whether the system groups duplicates, weights sources or counts distinct texts. Keep circulation and independent evidence separate: several different articles may still rely on the same underlying announcement.
How should I review sarcasm, quotations or ambiguous wording?
Read the surrounding text and identify whose view is being expressed. A positive word may appear in criticism or quoted speech. Inspect accessible examples before calling a classification wrong, and record ambiguity when the available context does not support a clear interpretation.
Does a high overall accuracy figure prove every category works well?
No. Ask for results by category and inspect the test sample. A system can appear accurate when one common category dominates while missing less common categories. Check how reference labels were assigned and whether the evaluation material resembles the language and sources you use.
Can I work out a platform’s formula from its screenshot?
A screenshot can show a field name and displayed value, but it rarely establishes the calculation, source selection or weighting. Use documented definitions where available. Otherwise, record what the image actually shows and leave the missing method explicit instead of reverse-engineering an unsupported formula.
Can a sentiment score establish the probability of a price move?
A measure of language or classification confidence does not, by itself, establish that probability. A forecast would need a defined outcome, time horizon and separate evaluation. Keep your research conclusion tied to the measured material rather than treating the displayed number as a prediction.
Provider documentation checked 6 October 2026. Examples and calculations are hypothetical educational illustrations from the CrowdSent Blog Team. They are not product test results, live readings or investment recommendations.