

A candlestick chart compresses a price interval into four numbers: open, high, low and close. Learning how to read a candlestick chart starts with those numbers, the interval they cover and the source that supplied them. A candle can tell you where a recorded interval began and ended. Its shape alone cannot reconstruct every move inside that interval.
This guide uses a fictional instrument quoted in price units. The same reading method can help you inspect stock, currency or crypto charts, provided you check the instrument and data conventions first. The goal is an accurate description of the evidence on screen, without turning a familiar shape into a prediction.
How to read a candlestick chart: start with OHLC
Open is the first relevant price in the interval. High is the greatest included price, and low is the smallest. Close is the final relevant price. “Relevant” depends on what the provider measures: executed trades, quotations or another defined series.
The candle body stretches between open and close. The thin extensions, often called wicks or shadows, reach toward the high and low. Colour conventions vary, so check the chart legend. The CME Group chart-types lesson explains these basic parts and distinguishes time-based bars from bars formed after a specified number of trades.
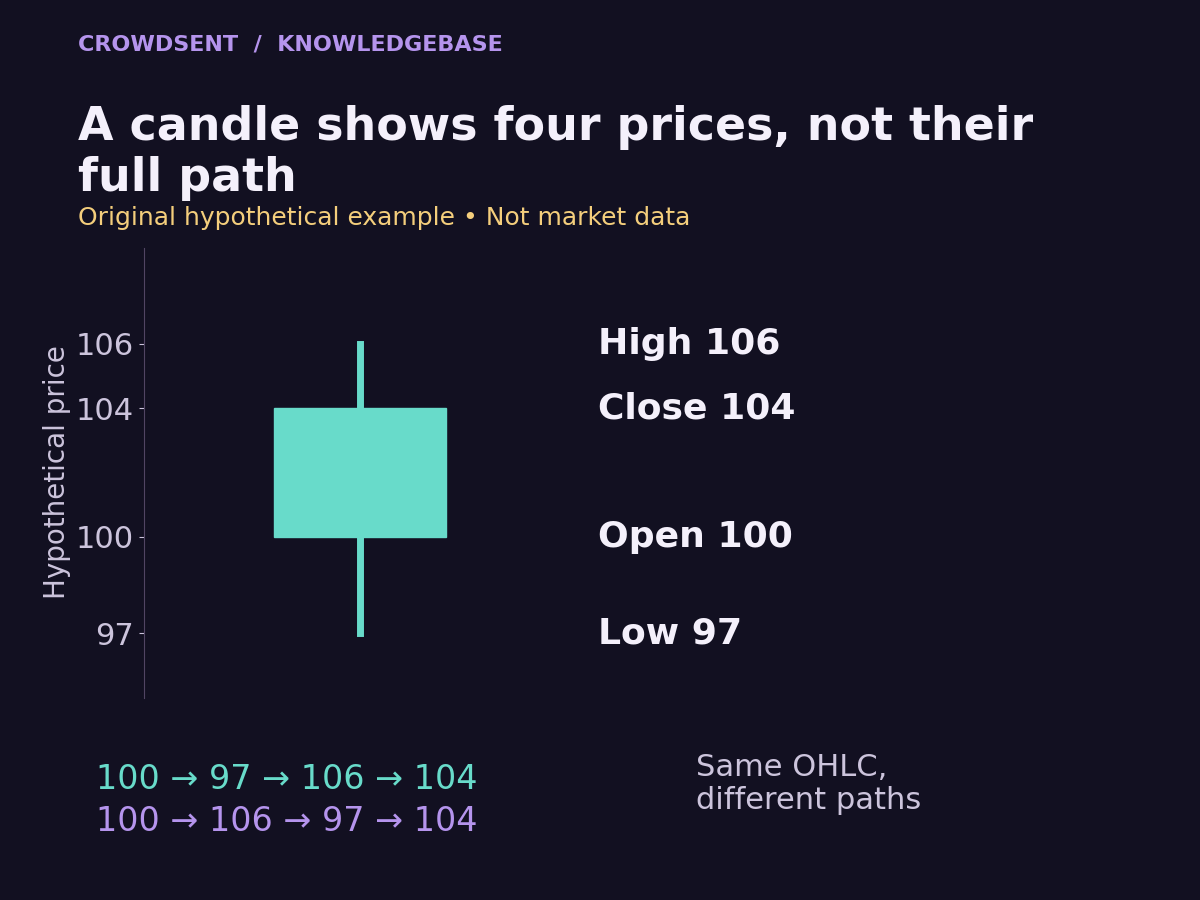
For our example, the open is 100, the high is 106, the low is 97 and the close is 104. The body runs from 100 to 104. Its length is 4 price units. The entire recorded range runs from 97 to 106, or 9 units. The upper extension is 2 units; the lower extension is 3.
A quick consistency check catches many reading mistakes: the high must be at least as large as both open and close, and the low must be no larger than either. If a displayed value breaks those rules, recheck the field labels, the selected candle and any transformations applied to the chart.
Find out exactly what one candle covers
A label such as “one hour” gives a duration, but it does not by itself identify the boundaries. Does a candle marked 14:00 cover the interval beginning at 14:00 or ending then? Which time zone is used? Does the provider omit periods when the relevant market is closed?
Imagine the example candle covers 14:00 up to, but excluding, 15:00 UTC. Its open of 100 belongs to the first included observation after the interval begins. Its close of 104 belongs to the final included observation before the boundary. Another provider could label the same interval 15:00 because it labels bars by their ending time.
As one concrete implementation, Coinbase Exchange’s candle documentation defines a bucket-start timestamp, first-trade open and last-trade close. It also warns that historical data may be incomplete and that intervals without ticks have no published data. These are provider-specific rules; check the documentation for whichever chart you actually use.
The rightmost candle may still be forming. In our fictional interval, a value of 104 at 14:30 is only the latest observation so far. A later trade at 107 would change the high. A final trade at 99 would change the close and the body. Record whether your screenshot shows a completed candle.
Aggregate smaller intervals without losing the extremes
In a separate hypothetical fifteen-minute example, suppose three complete, adjacent five-minute bars describe the same fictional instrument, venue and trade-price series. They cover 14:00 up to, but excluding, 14:15 UTC. Their values are:
- 14:00 bar: open 100, high 104, low 99, close 103.
- 14:05 bar: open 103, high 106, low 102, close 105.
- 14:10 bar: open 105, high 105, low 97, close 104.
The combined fifteen-minute candle opens at 100, the first bar’s open. Its high is 106, the largest of the three highs. Its low is 97, the smallest of the three lows. It closes at 104, the final bar’s close. This separate dataset happens to reproduce the illustration’s four values, while its smaller bars supply more timing detail.
Now try the calculation using only the three closing prices: 103, 105 and 104. The largest close is 105, which misses the recorded high of 106. The smallest close is 103, which misses the recorded low of 97. Averaging those closes would answer another question entirely. Neither shortcut reconstructs the larger candle.
Before combining records, check that the smaller intervals form the intended larger interval without gaps or overlap. Keep the same instrument, price definition, source and session rules. A missing middle bar means you cannot assume its high and low remained inside the values observed on either side. Mark the coverage as incomplete rather than silently inventing an interval.
The smaller bars also narrow one uncertainty: in this example, the high of 106 belongs to the middle interval and the low of 97 to the last interval. They still do not reveal every transaction inside either five-minute bar. More detail improves the record without removing the need to state what remains unknown.
Two different journeys can create the same candle
Now return to the original one-hour illustration. Treat the following as two alternative paths for that hourly candle, separate from the fifteen-minute dataset above. In sequence A, the price goes from 100 to 97, then to 106, and finishes at 104. In sequence B, it goes from 100 to 106, then to 97, and also finishes at 104. Both produce exactly the same open, high, low and close.
The difference matters when someone claims that the chart proves a specific sequence of reactions. Did the low occur before an announcement and the high afterward? Did the price cross a particular level once or repeatedly? The candle does not answer those questions. You would need finer observations with reliable timestamps.
Even smaller candles retain some compression. Five-minute bars can clarify which broad interval contained a high, yet they still leave movement inside each five-minute interval unresolved. A trade-by-trade record supplies more detail, but its coverage and timestamp meaning still need checking.
A candle also omits how much activity occurred at each price. A brief observation at 106 and repeated transactions at 106 can leave the same high. That is why a tall wick alone cannot identify the number of participants, their intentions or the depth available to another order. For that distinction, read liquidity versus volume.
Separate candle direction from the previous close
Our candle closes at 104 after opening at 100, an open-to-close increase of 4%. Now suppose the previous completed candle closed at 108. The new close is still 4 units below that previous close: 104 divided by 108, minus one, is approximately −3.70%. Both descriptions are correct because they use different starting points.
This is an easy source of confusing commentary. Someone says “the candle was up” while another says “the instrument fell.” One may be comparing close with open, while the other compares successive closes. Write down the denominator and reference observation before deciding that either person has misread the chart.
A gap between one close and the next open also needs context. Perhaps the displayed series excludes an overnight session. Perhaps no included trade occurred at an intervening price. Perhaps a corporate action or a data revision changed the historical series. The visible gap tells you to inspect the construction of the data; it does not identify its cause.
Why two charts of the same market may differ
Start with the full instrument identifier. A stock listing on one venue, a futures contract and a related index can all appear under similar familiar names. They are separate series. For currency or crypto pairs, the quote unit matters as well. The guide to BTC/USD versus BTC/USDT illustrates why a similar label does not guarantee an identical price definition.
Next compare the observation set. Imagine venue A records our high of 106, while venue B’s highest included transaction is 105.5. Both can accurately describe their own transactions. Combining venues can produce a third range. A chart based on bid prices may differ again from one based on completed trades.
Then check the session and daily boundary. Suppose a fictional market records 107 during an extended session, but only 106 during the main session. An all-session daily candle and a main-session daily candle will have different highs. Similarly, regrouping an around-the-clock series at different midnight boundaries changes which observations belong together.
Finally inspect adjustments and missing records. An adjusted historical stock series may restate earlier prices around a split; an unadjusted series may show a large mechanical step. If observations are missing, a smooth-looking candle does not prove complete coverage. Missing market data versus zero explains why filling a gap with a number can create a misleading comparison.
A short method for describing a chart responsibly
Write one sentence for identification: “This is the fictional instrument X, quoted in units, from source Y, using completed one-hour trade candles labelled by UTC start time.” Add whether the chart includes all sessions and whether the series is adjusted.
Write a second sentence for what you can directly observe: “For 14:00–15:00 UTC, the open was 100, the high 106, the low 97 and the close 104.” Then separate any unanswered question: “The candle does not establish whether the high preceded the low.”
This small discipline makes a chart reusable evidence. Another reader can check the same instrument, interval and fields rather than guessing what a screenshot meant. It also leaves room to revise the description when the provider supplies a correction. A screenshot without these details is much harder to audit later.
Frequently asked questions
What is the simplest way to read a candlestick?
Identify the interval, then locate open, high, low and close. Read the legend before assigning meaning to colour. Finally check whether the candle has finished forming and whether its prices refer to trades, quotes or a transformed series.
Does a green candle mean the price rose since yesterday?
Not necessarily. A common convention compares that candle’s close with its open. Yesterday’s close is a separate reference. A candle can close above its own open while remaining below the previous day’s close.
What does a long wick prove?
It shows the distance between an interval extreme and the nearer end of the body. By itself it does not reveal how long the price stayed there, which extreme came first or why participants transacted.
Can a candle have almost no body?
Yes. If open and close are equal or very close, the body can appear as a narrow line. The high and low may still be far apart, so a small body does not necessarily mean a small range.
Does the high always happen before the low?
No ordering is encoded in OHLC. The same four values can come from several sequences, including repeated visits to the high or low. More granular, timestamped data is required to investigate the order.
Why does the newest candle keep changing?
Its interval may still be open. Additional observations can move the latest close and extend the high or low. Treat that candle as provisional until the interval ends and the provider finalises or updates the record.
Is a one-hour candle sixty one-minute closes combined?
An hourly candle built from complete minute OHLC data uses the first open, highest high, lowest low and final close. Using minute closes alone can miss a high or low that occurred inside a minute.
Does changing the displayed time zone always change the candles?
No. Some interfaces relabel an existing series without regrouping observations. Others rebuild interval boundaries. Check whether the change affects only labels or the underlying aggregation, especially when comparing daily candles.
Do candlesticks include trading volume?
Standard OHLC values describe prices. Volume may appear in a separate panel or extra field. Do not infer transaction quantity from body size, wick length or the amount of screen space a candle occupies.
Can a candle pattern tell me what happens next?
The candle records an observed interval. A predictive claim requires a separate, well-defined test with suitable data and evaluation. Recognising a visual shape does not establish that future prices must follow a particular path.
The most useful first step is to turn the picture into a precise statement of instrument, source, interval and four prices. Once those details are clear, the chart becomes easier to compare and its unanswered questions become easier to see.