

By CrowdSent Blog Team
A yield curve places yields for different maturities on one chart. Read its axes, identify the chosen spread, and keep changes in slope separate from changes in yield levels. A worked four-point example makes those distinctions visible.
Read the yield curve’s maturity axis before the line
A yield curve compares yields across remaining maturities at a particular observation time. The horizontal axis shows time until maturity; the vertical axis shows yield. Moving from the two-year point to the ten-year point moves across maturities on the same snapshot. It does not move eight years into a forecast.
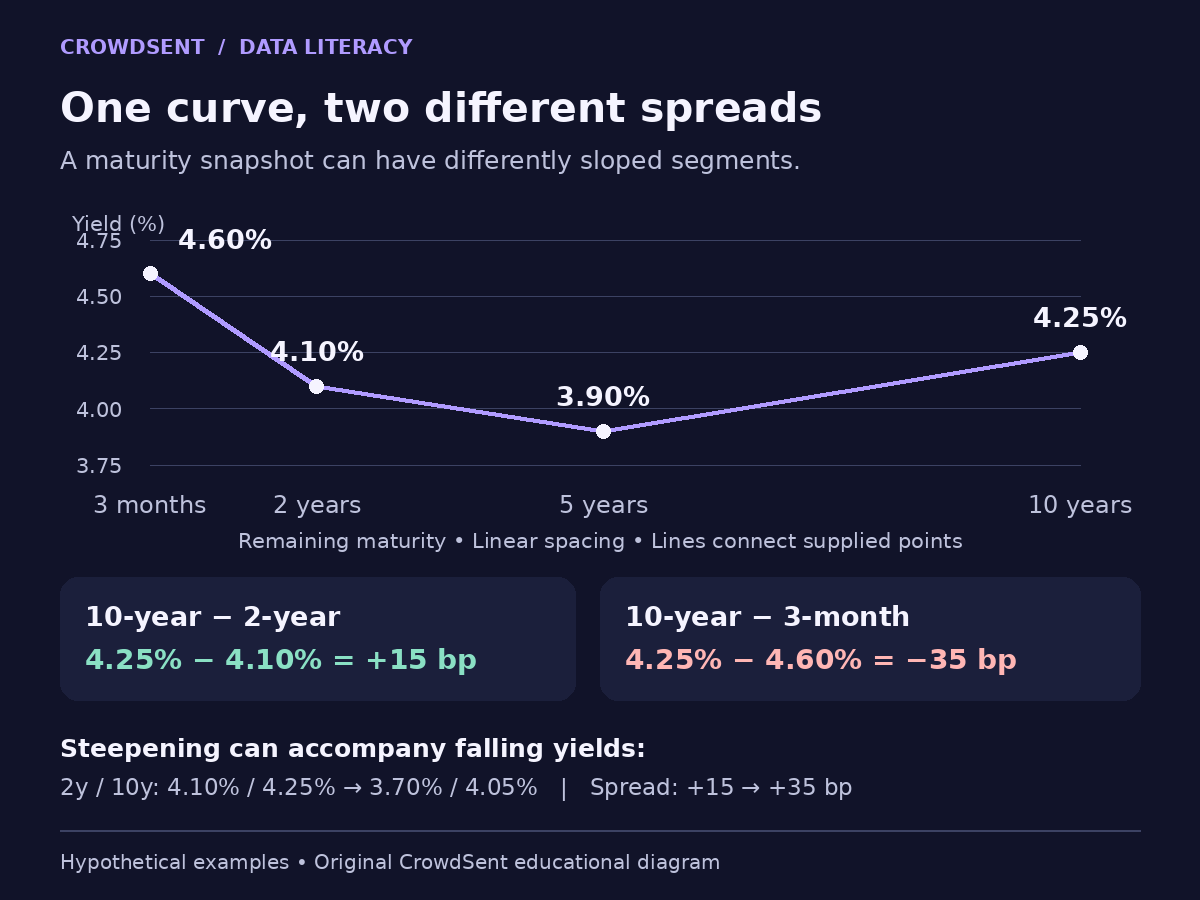
Start with a deliberately small curve: three months at 4.60%, two years at 4.10%, five years at 3.90%, and ten years at 4.25%. These invented observations describe a dip followed by a rise. Calling the whole curve simply “up” or “down” loses information about its middle.
A historical chart of the ten-year yield has a different horizontal axis: calendar time. Both charts may contain a line and a percent sign, so inspect the axis labels before reading a screenshot. A curve dated 9 October and a ten-year-yield history ending on 9 October answer different questions.
Keep issuer, currency, yield definition, and timestamp consistent across the points. Comparing a short government yield with a long corporate yield changes issuer exposure as well as maturity. You can make that comparison, but it needs a different description.
Know what the benchmark represents
The US Treasury’s published nominal curve is a par yield curve. Its yield-curve methodology says that it is constructed from indicative bid-side prices around 3:30 p.m. on trading days, rather than a list of completed transactions. The published points are derived using a curve-fitting method.
In practical terms, a standard maturity point is a benchmark calculation. It need not identify one particular bond that you can buy at exactly that yield. “Ten-year Treasury yield” in a source table therefore needs the source’s definition beside it.
A par yield refers to the coupon rate that would make a conventional bond price equal to its face value under the curve’s conventions. A spot rate instead relates to a single payment at a specified future date. These are different curve concepts; copying points from each into one line produces a hybrid.
For a basic reading exercise, stay with one published curve family. Do not combine a bill’s bank-discount quote with a longer bond’s differently calculated yield just because the maturities fit the desired axis. The percentage sign cannot tell you whether the calculation conventions match.
The guide to bid-ask spreads helps explain why a quote’s side belongs in its description. Here, bid-side inputs are a methodological detail, not a claim that the curve is an executable offer.
Worked example: two spreads, two answers
Return to the four hypothetical maturity points. A spread must state which yield is subtracted from which. For the common long-minus-short convention, calculate:
- Ten-year minus two-year: 4.25% − 4.10% = +0.15 percentage point, or +15 basis points.
- Ten-year minus three-month: 4.25% − 4.60% = −0.35 percentage point, or −35 basis points.
- Five-year minus two-year: 3.90% − 4.10% = −0.20 percentage point, or −20 basis points.
The ten-year–two-year segment slopes upward, while the ten-year–three-month comparison is inverted. Neither calculation is faulty. The short endpoint differs. A headline saying “the curve has uninverted” is incomplete until it names the pair.
One basis point equals 0.01 percentage point. Because the inputs above are already written in percentage units, multiply the numerical percentage-point difference by 100 to obtain basis points. If your spreadsheet stores 4.25% as 0.0425, multiply the decimal difference by 10,000 instead.
Reversing the subtraction changes the sign. Two-year minus ten-year is −15 basis points in this example. A negative value therefore establishes inversion only after the subtraction convention is known. Write the formula in the column header rather than relying on a chart’s colour.
The spread compresses two observations into one number. Keep both yields next to it. Otherwise, a later reader cannot reconstruct the starting level or determine which endpoint changed.
Separate a change in slope from a change in level
Now compare two hypothetical dates using only the two-year and ten-year points. On Date A, they are 4.10% and 4.25%; the spread is +15 basis points. On Date B, they are 3.70% and 4.05%; the spread is +35 basis points.
The two-year yield fell 40 basis points and the ten-year yield fell 20. The long-minus-short spread increased 20 basis points, so this segment steepened while both yields declined. “Steepened” describes the change in the difference, not the direction of every point.
A separate Date C could show 4.30% and 4.65%. Compared with Date A, those yields rose 20 and 40 basis points, yet the spread again reached +35. The same steepening can accompany rising or falling yield levels.
A parallel shift is another useful classroom case. If both Date A yields rose 30 basis points, they would become 4.40% and 4.55%. The spread would remain +15. The entire two-point segment moved higher without changing its slope.
These cases suggest a clear reporting order: state each endpoint’s move, then the spread change. “Two-year down 40, ten-year down 20, spread wider by 20 basis points” is more informative than an unexplained label.
What shape can tell you, and what needs more evidence
Yield differences can reflect more than expectations of future short-term rates. The New York Fed research on expectations and bond yields separates expected short rates from term premiums. A term premium is an estimated component of a yield, whereas a two-maturity spread is directly calculated from two quoted rates.
Do not label our +15-basis-point spread “the term premium.” Estimating that component requires a model or another stated approach to expectations. Subtracting two yields alone does not perform the decomposition.
Inversions also appear in economic discussion because of their historical relationship with recessions. The St. Louis Fed’s educational discussion of inversion cautions that the historical association does not mean an inversion causes a recession or that every inversion must be followed by one.
That leaves useful questions to ask without making a forecast. Which maturity pair was studied? Did the study use daily observations or monthly averages? What counted as a signal? What sample and outcome window were used? An intraday chart and a long-run statistical study are different kinds of evidence.
A yield curve also cannot supply a central bank’s words. If someone attributes its shape to a policy announcement, check the document and its timestamp. The FOMC statement and minutes guide distinguishes the decision release from the later account of the discussion.
Make a yield curve comparison reproducible
Build a short source note before drawing two curves on one chart. Record the curve family, currency, publisher, observation dates, yield units, maturity labels, and any unavailable points. Use the same horizontal and vertical scales for both snapshots.
Spacing matters visually. Equal spacing between three months, two years, five years, and ten years is a category chart, not a linear scale of time to maturity. Either presentation can be readable, but label the choice. Do not let a decorative line imply that every horizontal interval represents the same number of years.
Similarly, a narrow vertical range can make a small movement look dramatic. Show the yield tick labels clearly. A move of 20 basis points remains 20 basis points whether the chart fills a screen or occupies a small card.
For readers in India and Pakistan, a US-dollar Treasury curve is a US benchmark. It is not a domestic borrowing-rate schedule, a local-currency return, or an assessment of access to securities. When comparing countries, currency and issuer differences remain even after the maturity labels match.
A useful final note for our example reads: “Hypothetical nominal curve; 10y–2y +15 bp; 10y–3m −35 bp; four stated maturities.” Preserve that note and the inputs in a market research journal. Another reader can then reproduce the observation without accepting any economic story attached to it.
Frequently asked questions
What does an inverted yield curve mean?
For a specified pair using long-minus-short subtraction, the longer yield is below the shorter yield. Name the pair. Our example is inverted from three months to ten years but has a positive ten-year–two-year spread.
Can a curve slope down and then up?
Yes. Different segments can have different slopes. The hypothetical curve declines through five years and then rises toward ten years. A single two-point spread does not capture that whole shape.
Is the horizontal axis a prediction timeline?
It shows time to maturity for yields observed at one date. A ten-year point is not a direct forecast of the rate that will prevail ten years later. Check whether a chart is a maturity snapshot or a history over calendar dates.
How do I convert a yield spread into basis points?
Subtract yields on the same scale. A difference of 0.15 percentage point equals 15 basis points. If the spreadsheet stores yields as decimals, 0.0425 minus 0.0410 equals 0.0015; multiply by 10,000.
Does a steeper curve mean yields rose?
Not necessarily. Our Date B example steepens because the short yield falls more than the long yield. To describe the move fully, retain both endpoint changes as well as the change in their difference.
Can the spread stay unchanged while yields move?
Yes. Adding the same number of basis points to both endpoint yields leaves their difference unchanged. Our parallel-shift example moves each yield up 30 basis points while preserving the +15-basis-point spread.
Is the Treasury par curve a list of trade prices?
No. Treasury describes indicative price inputs and a fitted par curve. Its standard-maturity yields are benchmark calculations. They should not be presented as a guaranteed transaction price or an offer available to a particular reader.
Is a ten-year–two-year spread the term premium?
They are distinct calculations. The spread subtracts two yields; a term-premium estimate separates a yield into components using assumptions about expected rates. Keep the estimate’s methodology and source with the label.
Does one day of inversion establish a recession date?
No. The observation identifies the sign of a stated spread at that time. A claim about future activity needs a separate statistical framework, and historical relationships do not turn a daily observation into a guaranteed outcome.
Can I compare curves from different countries?
You can describe them with clear labels, but matching maturities alone does not make them equivalent. Issuer, currency, inflation context, and measurement conventions differ. A higher foreign-currency yield does not itself establish a higher local-currency outcome.
Educational information only. All worked-example figures are hypothetical and do not describe current market conditions. This article does not provide financial advice or forecasts.