

Win rate vs expectancy is a comparison between how often an outcome is positive and how much the complete set of outcomes contributes on average. A record can contain more winning trades than losing trades while still showing a loss. To understand why, the counts need to sit beside the sizes of the gains, losses and costs.
This guide builds the calculation from a closed-trade ledger. All examples are hypothetical, use one account currency and describe arithmetic rather than a trading recommendation. Historical results do not establish the probabilities or payoffs of future trades.
Win rate vs expectancy: define the observation first
For this article, one observation is one completed trade, and a win is a strictly positive result under the stated cost convention. Win rate equals winning trades divided by all completed trades. Open positions are outside this particular statistic.
That definition follows the count-based approach in TradingView’s percent-profitable documentation, which includes break-even trades in the denominator. Other reports can use different grouping rules, so the label alone is insufficient.
Suppose a single position has three partial exits. An export might show three realized outcomes, while a journal groups them into one completed position. Both records can reconcile to the same cash profit, yet produce different win rates. Write down the counting rule before calculating anything.
Build expectancy from weighted outcomes
Let p be the proportion of winning trades, W the average winning amount, and L the average losing amount expressed as a positive number. With only winners and losers, the observed average outcome is:
Average outcome = p × W − (1 − p) × L.
The weighting matters. W summarizes the winning subset; L summarizes the losing subset. Subtracting W − L without the frequencies would give those groups equal weight even when their counts differ.
CME Group’s mathematical-expectation lesson describes the same frequency-and-size structure. In probability language, expected value is a probability-weighted sum of outcomes. In a historical ledger, observed frequencies and averages produce a sample estimate, not knowledge of the next result.
A useful reconciliation is total included profit or loss divided by the number of included trades. If that direct average disagrees with the weighted calculation, the two calculations probably use different rows, costs, currencies or definitions of a trade.
Hypothetical example: a 60% win rate with a negative average
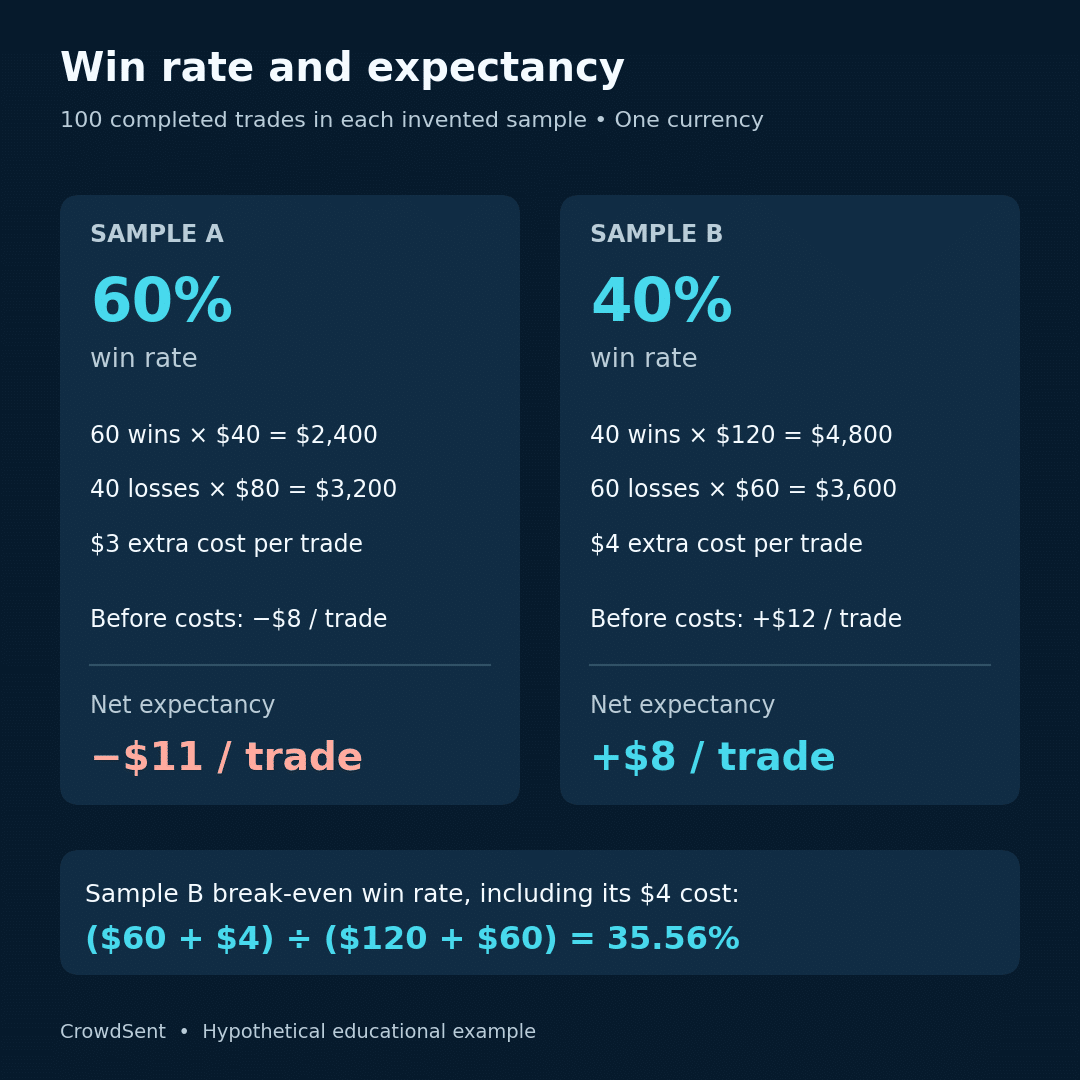
Consider 100 completed trades before separately charged commissions:
- 60 winners averaging $40: total gains of $2,400.
- 40 losers averaging $80: total losses of $3,200.
- Win rate: 60 ÷ 100 = 60%.
- Average before commissions: 0.60 × $40 − 0.40 × $80 = −$8.
The same result appears directly: ($2,400 − $3,200) ÷ 100 = −$8 per completed trade. The winning group has more observations, but the losing group contributes more dollars.
Now suppose each completed trade also has a $3 commission charge not included in those outcomes. Total commissions are $300. The final included result is −$1,100, and the average becomes −$11. Assume each gross winning trade exceeds $3, so all 60 winners remain positive after the charge. Under that explicit assumption, the net win rate remains 60%.
That last detail cannot be assumed for every ledger. A $2 pre-commission gain with a $3 charge becomes a $1 net loss. Reclassifying the trade changes both the net win rate and the net average winner or loser.
Hypothetical example: a lower win rate with a positive average
A separate 100-trade sample contains 40 winners averaging $120 and 60 losers averaging $60 before an additional $4 cost per trade. Its win rate is 40%.
The pre-cost average is 0.40 × $120 − 0.60 × $60 = $12. Subtract the $4 average cost once, and the net average is $8. The full ledger check is $4,800 of gains minus $3,600 of losses minus $400 of costs, leaving $800.
These invented samples demonstrate why a win-rate ranking cannot determine an average-outcome ranking. They say nothing about which live strategy is suitable, how much capital either requires or how reliably the results could be repeated.
They also show why “expected” needs a label. “Observed net expectancy: $8 across these 100 completed trades” identifies a measured sample. “Expect $8 from every future trade” would claim much more than the arithmetic establishes.
Calculate the break-even win rate with costs
For a two-outcome model with pre-cost average win W, pre-cost average loss L and the same additional cost c per trade, set the average outcome to zero:
0 = pW − (1 − p)L − c, so p = (L + c) ÷ (W + L).
Using W = $120, L = $60 and c = $4 gives $64 ÷ $180, or approximately 35.56%. Ignoring costs would produce $60 ÷ $180, or 33.33%. The difference is approximately 2.22 percentage points using the unrounded rates.
This is a conditional break-even calculation. It holds the win amount, loss amount and cost assumptions fixed. Changing an exit rule might change all three inputs and the frequency of winning, so the formula cannot isolate a free improvement.
If costs differ by outcome, use p × (W − cw) − (1 − p) × (L + cl). If W and L already describe net outcomes, use those net amounts directly. Subtracting the same costs again would understate the result.
Handle zero outcomes and execution costs explicitly
With genuine zero-result trades, use pwW − plL, where pw and pl are calculated over all included trades. The remaining probability belongs to zero outcomes. Do not automatically replace pl with 1 − pw.
For example, 40 winners of $120, 50 losers of $60 and ten zero outcomes produce an average of $18 across 100 observations before additional costs. A $4 charge on every observation reduces the average to $14, and the ten gross-zero observations become net losses.
Commissions, financing and execution assumptions need separate attention. The SEC’s guide to investment fees and expenses explains why transaction and ongoing charges affect results. A backtest based on a reference price may need explicit spread and slippage assumptions. Actual entry and exit fills already reflect their execution prices; avoid adding the same price disadvantage twice.
CrowdSent’s bid–ask spread guide helps separate quote sides from a single reference price. The pips, lots and contract-size guide is useful when converting instrument moves into consistent monetary amounts.
Read the sample without turning it into a forecast
An average can depend heavily on one large observation. Imagine the $800 net sample above includes a single $900 net winner. Removing it leaves −$100 across the remaining 99 trades. This sensitivity check describes concentration in the sample; it does not justify deleting an inconvenient observation from the official result.
The number of rows also matters. Under a simplified independent, constant-probability win/loss model, the estimated win-rate standard error is the square root of p(1 − p)/N. For p = 40% and N = 100, it is about 4.9 percentage points. The NIST binomial reference sets out the underlying model.
Real trades may cluster, overlap or respond to the same market event, so this shortcut is not a universal uncertainty measure. It also says nothing about uncertainty in W or L. Record sample dates, market coverage and any rule changes beside the estimate.
A compact ledger-check checklist
- Fix the observation unit, date range and closed-position rule.
- Use one currency and a documented conversion method.
- State whether outcomes are gross or net, and reconcile charges once.
- Count winners, losers and exact-zero results separately.
- Reconcile the weighted average to total P&L divided by trade count.
- Inspect unusually large outcomes and disclose sample limitations.
Keep those definitions in a market research journal so the next report can be compared on the same basis.
Frequently asked questions
1. Does a win rate above 50% imply a positive expectancy?
No. In the first example, 60% of trades win, but the average loss is twice the average win. The weighted average is negative before costs and more negative after them.
2. Is expectancy the same as the next trade’s likely outcome?
No. It is an average across a distribution or an estimate from a sample. None of the individual trades in a sample needs to equal that average.
3. Should break-even trades be excluded?
Only if the report explicitly defines a conditional measure that excludes them. For the all-completed-trades convention here, zero outcomes remain in the denominator and contribute zero before any additional cost.
4. Can expectancy be expressed in risk units?
Yes, if each outcome is divided by a clearly documented initial risk amount. Averaging those normalized outcomes answers a different question from averaging dollars when position sizes vary.
5. Is a planned reward-to-risk ratio enough to calculate expectancy?
No. A planned target and stop do not establish realized average outcomes or their probabilities. Partial exits, execution differences and changed exits can separate the plan from the ledger.
6. Why do two platforms show different win rates?
Check partial-exit grouping, zero-result treatment, open positions, cost classification and date boundaries. A different denominator can change the statistic even when both exports reconcile to the same account balance.
7. Can costs alter the win rate itself?
Yes. Small gross winners may become net losers after charges. Calculate net classifications from net outcomes rather than simply attaching a cost note to the original gross win rate.
8. Does positive dollar expectancy describe compounding?
No. Dollar expectancy averages trade outcomes. Compounded account performance also depends on capital, exposure, cash flows, position sizing and the sequence in which percentage gains and losses occur.
9. Is there a universal minimum sample size?
No single count resolves stability, dependence and changing conditions. A large set of similar, overlapping trades can contain less independent information than the row count suggests.
10. What should accompany an expectancy figure?
Include the sample period, trade count, unit, gross/net basis, zero-outcome convention and average win and loss. Those fields make the result reproducible and reveal what the headline leaves out.
To explore the workspace and its membership options, open CrowdSent.
Educational note: This article explains measurement methods. It is not investment advice, a strategy endorsement or a promise of future results.