

By CrowdSent Blog Team
Market volatility measures variation in returns. Learn how the calculation works, why the time window matters, and what a volatility percentage can and cannot tell you.
What is market volatility?
Market volatility describes how much market returns vary over a stated period. A common statistical measure is the standard deviation of returns: how widely individual observations are spread around their average. A volatility number needs a market, a sampling interval, a lookback window, and a calculation convention before it becomes interpretable.
The direction of a move is a separate question. A sequence of large gains can be volatile, as can a sequence containing both gains and losses. A market that finishes a week close to where it started may have taken a very uneven route. Looking only at the starting and ending prices hides that route.
The Options Industry Council’s technical guide describes historical volatility as a statistic drawn from observed price changes. That backward-looking scope matters: a well-measured past does not settle what happens next.
In ordinary conversation, people also use “volatile” to mean fast-moving or unsettled. When a chart attaches a percentage to the word, ask which formal measure produced it. Standard deviation, an intraday range, and a volatility index answer related but different questions.
Start with returns rather than price-point moves
A movement of five price units has a different meaning when an asset starts at 50 than when it starts at 500. Percentage returns put those changes on a more comparable scale. A simple return is the new price divided by the previous price, minus one. Multiply by 100 to express the result as a percentage.
For example, moving from 100 to 102 produces a return of 2%. Moving from 102 back to 100 produces a return of about −1.96%. The second denominator is larger, so equal price-point moves in opposite directions do not create equal percentage returns. This is why a return series should be calculated from each consecutive pair of observations.
The unit of time belongs beside the result. Daily returns describe daily observations; five-minute returns describe five-minute observations. A daily close can conceal substantial movement between the opening and closing prices. Two datasets with the same final daily price can therefore describe very different intraday experiences.
Before doing any calculation, choose whether the question concerns price returns or total returns including distributions. For equities, corporate actions such as splits also require a consistent adjusted series. A mechanical price adjustment should not accidentally become the biggest “market move” in your dataset.
A worked example: the same average return, different paths
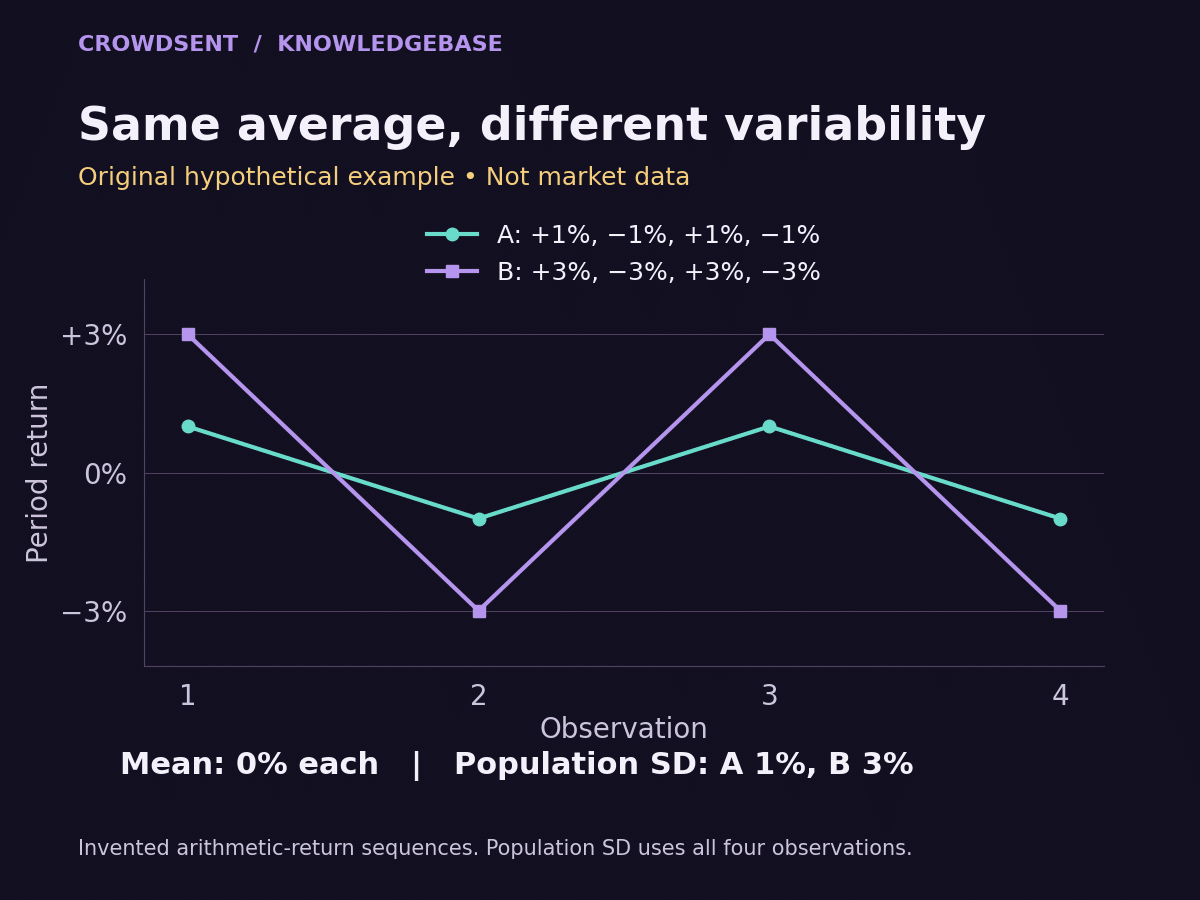
Consider two hypothetical four-period return sequences. Sequence A is +1%, −1%, +1%, −1%. Sequence B is +3%, −3%, +3%, −3%. Each has an arithmetic mean return of zero. Their average direction is identical, but their observations sit at very different distances from that average.
For a transparent classroom calculation, treat the four observations as the entire population being described. Square each distance from the mean, average the squared distances, and take the square root. In Sequence A, every squared distance is 1 in percentage-point-squared units, giving a standard deviation of 1%. In Sequence B, every squared distance is 9, giving a standard deviation of 3%.
The second sequence has three times the volatility under this specific convention. It does not have three times the expected gain, three times the probability of a loss, or a guaranteed next move of 3%. Those claims require information this calculation does not contain.
Now compound each sequence from a starting value of 100. Sequence A ends at 100 × 1.01 × 0.99 × 1.01 × 0.99, or about 99.98. Sequence B ends at 100 × 1.03 × 0.97 × 1.03 × 0.97, or about 99.82. Both finish close to their starting value, while B travels through larger changes.
A sample-standard-deviation formula would divide the squared deviations by three rather than four. It would return approximately 1.155% and 3.464%. Neither pair should be mixed with the other without explanation. State the convention, especially when trying to reproduce a platform’s number.
Read the window and annualization convention together
A 20-observation calculation and a 250-observation calculation can disagree because they describe different histories. A recent jump occupies a large share of the short window and a much smaller share of the long window. When it eventually leaves a rolling window, the statistic can fall even if nothing unusual happened on that day.
Annualization changes the reporting scale. Under a common simplifying convention, daily standard deviation is multiplied by the square root of the assumed number of observations in a year. If daily volatility is 1% and the chosen convention is 252 trading days, the annualized figure is about 15.87%. Multiplying by 252 instead would be incorrect for this convention.
That conversion rests on assumptions about how returns accumulate through time. Serial dependence, shifting volatility, and jumps can make square-root scaling a poor description of actual longer-period uncertainty. The NIST guide to statistical measures of spread is a useful starting point for the statistic itself; the data provider’s methodology is needed for its implementation.
Do not silently carry an equity trading-day convention into a continuously quoted market. Equally, “30-day volatility” may mean a 30-day historical window, a forward-looking horizon, or an annualized statistic computed from that window. The number alone does not resolve the ambiguity.
What volatility leaves out
Standard deviation compresses a sequence into one number. Rearranging exactly the same returns leaves the statistic unchanged, even though a cluster of losses can feel very different from losses separated by gains. It also does not reveal the largest peak-to-trough decline, which is a drawdown question.
Nor does a small measured value establish that an asset is easy to buy or sell. Prices may appear quiet when transactions are sparse or quotes are stale. CrowdSent’s explanation of liquidity versus volume helps separate variability from the availability of counterparties and market depth.
A complete risk description may also need information about leverage, issuer failure, currency exposure, settlement, and the possibility of rare large moves. A single standard deviation cannot summarize those different mechanisms. Even comparisons of two volatility figures are meaningful only when their inputs and units line up.
Options add another distinction. Implied volatility is inferred from option prices and a pricing framework, whereas the historical statistic uses observed returns. The Options Industry Council’s volatility overview introduces that separation. Neither label, by itself, tells you that a future price must move up or down.
Build a volatility note someone else can reproduce
Write a small record before interpreting a screenshot: the exact instrument and venue, currency, observation timestamp, return interval, start and end dates, adjustment method, statistical formula, and annualization factor. If any field is unavailable, mark it unknown instead of supplying a familiar default.
Next, inspect the return series around unusually large observations. Check whether each represents a genuine market move, a split, a missing price, a venue change, or a timezone mismatch. A missing observation should not automatically become a zero return. The guide to missing market data versus zero explains why those entries convey different evidence.
Finally, make the interpretation narrower than the evidence. “Daily returns varied more over this sample than over the previous sample” is testable. “The market is about to fall” adds a forecast that the measurement has not earned. A market research journal can keep the observation, possible explanation, and unresolved question in separate fields.
If another reader cannot reconstruct what was measured, the solution is usually better labeling before more elaborate analysis. A modest, clearly documented statistic is more useful than a precise-looking percentage with an unknown history.
Frequently asked questions
Does high volatility mean prices are falling?
No. Volatility concerns the spread of returns. Large positive moves can raise it, and a sequence of alternating gains and losses can produce high volatility with little overall price change. Check the actual return path before describing direction.
Can a steadily falling market have low measured volatility?
Yes. If returns are consistently close to the same negative value, their dispersion around the average can be small. That market can still accumulate substantial losses. The average return and variability measure different parts of the experience.
Is volatility the same as the day’s high-to-low range?
No. A range uses two endpoints within a period. A standard-deviation calculation uses a series of returns. Two sessions can have the same high and low but very different paths and closing returns. Name the measure when comparing them.
Why do two websites show different historical volatility?
They may use different closing times, return definitions, lookback windows, price adjustments, sample formulas, or annualization factors. Compare those settings before assuming that one website is wrong. Also check whether both values refer to the same instrument and date.
What does annualized volatility of 20% actually tell me?
It reports variability on an annual scale under a stated method. It does not promise a 20% annual gain, cap losses at 20%, or say that every year will move by that amount. Interpretation still depends on the underlying window and assumptions.
Should I use simple returns or logarithmic returns?
Both appear in research. Simple returns are intuitive for consecutive percentage changes, while logarithmic returns have useful time-aggregation properties. Use the definition required by your research question or provider, document it, and avoid mixing the two within a comparison.
Does a longer history always give a better volatility estimate?
A longer window uses more observations but blends more market conditions. A short window reacts faster and can be dominated by a few unusual days. “Better” depends on whether the question concerns a recent episode or a broader historical pattern.
Can missing prices make a market look less volatile?
Yes, particularly if missing entries are filled with the last observed price and treated as new observations. That procedure creates artificial zero returns. Missing-data handling should be visible in the methodology, and any resulting limitation should accompany the statistic.
Does low volatility mean low overall risk?
It means only that the selected measure is low. A quiet observed price history does not remove concentration, leverage, liquidity, operational, or sudden-jump risks. Explain which type of uncertainty is being measured rather than treating volatility as a universal safety rating.
What is the shortest useful volatility description?
Include the instrument, return interval, lookback window, annualization convention, and observation date. For example: “Hypothetical daily-return standard deviation over 20 sessions, annualized with 252 days.” Those labels make the percentage far more interpretable than “volatility is high.”
Educational information only. Examples are hypothetical and are not forecasts, recommendations, or investment advice.