

The US Dollar Index, commonly called DXY or USDX, measures the dollar against a fixed basket of six currencies. An increase means the dollar has strengthened against that weighted basket over the comparison period. It gives a concise view of one part of the currency market.
The important word is basket. A headline saying “the dollar rose” may refer to DXY, one currency pair, or a broader index. Those statements can describe different changes. Understanding which measurement is being used is especially useful when your own research concerns Indian rupees, Pakistani rupees, or locally priced goods.
This guide explains what enters DXY, how to read its movement, and how to keep a dollar-index observation within the limits of its evidence.
What is in the US Dollar Index?
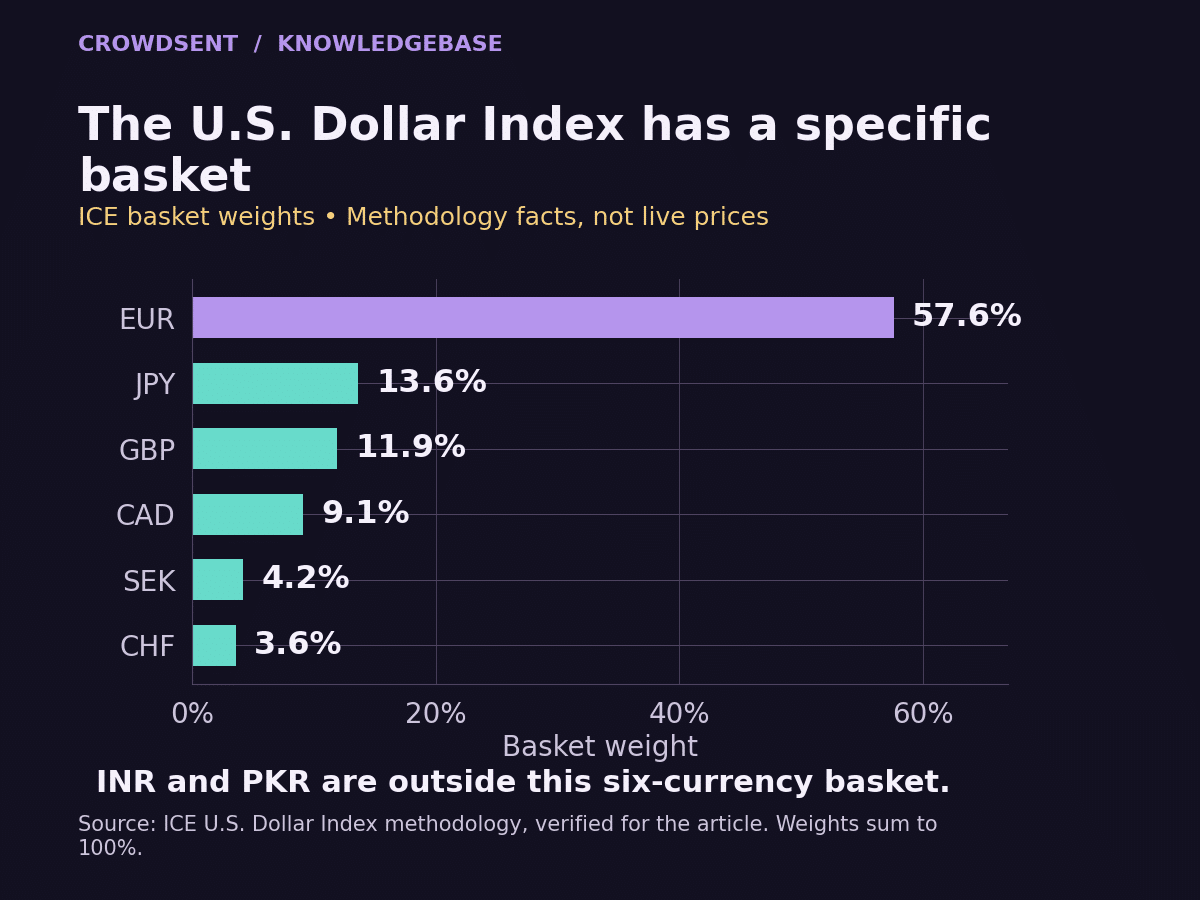
ICE identifies six constituent currencies and these fixed weights:
- Euro, EUR: 57.6%
- Japanese yen, JPY: 13.6%
- British pound, GBP: 11.9%
- Canadian dollar, CAD: 9.1%
- Swedish krona, SEK: 4.2%
- Swiss franc, CHF: 3.6%
The weights total 100%. The euro has more than half the weight, so an equal-sized percentage movement involving the euro has greater influence on the index than one involving any single smaller constituent. ICE lists the basket in its explanation of the dollar benchmark.
These percentages describe the index calculation. They are not survey responses, probabilities that a currency will rise, or the share of worldwide foreign-exchange activity occurring in each currency.
Consider the question you are trying to answer. “What happened to this particular weighted basket?” fits DXY directly. “What happened to the dollar against every currency?” asks for information that six constituents cannot supply. A clearly named measure makes the resulting claim easier to check.
How does DXY combine the currencies?
DXY uses a weighted geometric calculation. Currency rates are combined through multiplication and weight-based powers, rather than adding six quoted exchange rates and dividing by six. ICE’s index composition overview also distinguishes the underlying index from futures contracts based on it.
A simple average of the displayed currency-pair numbers would be misleading. One pair might be quoted near a single unit and another in many units because their currencies have different denominations. A large quote number does not establish a large economic weight.
Quote direction matters too. EUR/USD expresses dollars per euro; USD/JPY expresses yen per dollar. A rising EUR/USD means a dollar buys fewer euros, while a rising USD/JPY means a dollar buys more yen. Both numbers can rise while describing opposite changes in the dollar’s bilateral strength.
The index calculation accounts for these quotation differences. When reading the underlying pairs, write the units beside the rate before deciding what “up” means. Our guide to base currency and quote currency explains that convention in more detail.
The index’s historical reference level is 100 for March 1973. A hypothetical reading of 110 would be 10% above that base under the index methodology. It would not tell you what one dollar buys in a shop or establish the dollar’s fair value. ICE’s technical explanation of the index formula documents its geometric construction and original base.
A worked example: one currency changes
Imagine a deliberately simplified situation in which EUR/USD falls exactly 1%, while the other five constituent exchange rates stay unchanged. These are hypothetical movements, not observations or forecasts.
Because the euro’s weight is 0.576 and the euro is quoted in dollars, the index multiplier for this isolated change is 0.99 raised to the power of −0.576. That is approximately 1.0058. DXY therefore rises by roughly 0.58%.
If its starting value were an illustrative 100, the resulting value would be about 100.58. The example shows why applying the entire 1% euro move directly to the index would overstate the result.
Now allow other currencies to move. Some could reinforce the euro’s contribution, while others could offset it. You would need all six appropriately oriented exchange-rate changes to calculate the total accurately. The 0.58% result applies only to the stated assumption that everything else stayed still.
For small moves, weight multiplied by the relevant percentage change can provide an approximation to a component’s influence. Exact geometric calculations are preferable when precision matters or movements are larger. Keep an approximate contribution visibly separate from an exact index return.
There is another useful distinction: index points and percentages. A move from 100 to 101 is one point and 1%. A move from 120 to 121 is also one point, but approximately 0.83%. Always divide the point change by the starting level when calculating a percentage change.
Why can the index and a dollar pair disagree?
A basket can rise even while one constituent moves against it. Suppose dollar strength against the euro and several other currencies outweighs dollar weakness against the yen. The combined result can be a higher DXY alongside a lower USD/JPY.
There is no need to resolve that observation by declaring one chart wrong. First align the timestamps, then inspect the basket. A summary and one of its components answer different questions.
Likewise, a nearly unchanged index can hide offsetting movements. “DXY was flat” describes the net result. It does not establish that all six currency pairs were quiet. When a headline suggests widespread dollar strength, checking how many constituents moved in that direction adds useful evidence about breadth.
Be equally careful with cause. The index calculation tells you how exchange-rate inputs combine; it does not explain why those inputs changed. An explanation involving interest-rate expectations, economic news, or demand for a currency needs its own evidence and a suitable time window.
What DXY tells readers in India and Pakistan
Neither the Indian rupee nor the Pakistani rupee is a constituent of DXY. A change in USD/INR or USD/PKR therefore does not enter the index directly. Treat a DXY observation as background when your actual question concerns either rupee.
For example, imagine that DXY rises over a week while a verified USD/INR series changes very little. The defensible summary records both observations. Substituting the DXY return for the rupee pair would turn contextual information into an unsupported exchange-rate estimate.
The same care applies to a dollar-denominated invoice. To translate a hypothetical USD 100 expense into rupees, the relevant input is the applicable USD/INR or USD/PKR conversion rate, along with any transaction-specific charges. A DXY reading of 100 cannot perform that conversion; it is an index level, not rupees per dollar.
Locally quoted gold also requires more than a dollar-index chart. Identify the metal’s unit, currency, quoted market, and timestamp before comparing prices. Our guide to factors affecting gold prices provides a broader research framework. No single basket movement guarantees a particular local gold-price change.
Knowing an index’s definition also says nothing about whether a particular financial product is available or appropriate in your jurisdiction. Keep educational benchmark research separate from questions about access, account eligibility, or local requirements.
How does DXY differ from a broad dollar index?
The Federal Reserve publishes dollar indexes designed around international trade. Its broad index uses a larger set of trading-partner currencies, and its weighting framework includes goods and services trade. The Fed explains the design in its dollar-index methodology note.
This creates a practical comparison rule: match the benchmark to the question. A chart specifically discussing DXY should retain DXY’s basket and definitions. A study about the dollar across a broader trading-partner set may need a broader index and its corresponding documentation.
Two indexes can also use different reference dates. Comparing their raw levels, such as 105 and 120, does not establish that one shows a stronger dollar. For a selected period, calculate each series’ percentage change from its own starting level. Even then, explain the differing coverage.
Record whether the chosen series is nominal or adjusted for relative prices. Mixing differently defined measures in one sentence can obscure whether your observation concerns exchange rates alone or a broader competitiveness calculation.
A short checklist before quoting a DXY move
- Name the series. Record the provider and whether the chart represents the underlying index, a dated futures contract, or another instrument.
- Set the comparison. Write both timestamps and the timezone, plus whether observations are intraday readings or closing values.
- Check the arithmetic. Separate index-point changes from percentage changes and use the correct starting value.
- Inspect the claim. Decide whether your sentence concerns the six-currency basket, one constituent, or a currency outside it.
- Preserve the evidence. Save the source and record any visible delay, missing observation, or chart adjustment.
A useful research note might say: “This source’s DXY series increased over the selected window; the separate rupee pair requires its own measurement.” Add the actual values only after checking them. Our market research journal guide can help make that record repeatable.
Frequently asked questions
1. Are DXY and USDX the same thing?
They are common labels for the US Dollar Index. On a particular platform, still inspect the full instrument description. A familiar abbreviation can appear beside an underlying index, a futures series, or another product linked to the benchmark.
2. Why does the euro have so much influence?
Its 57.6% calculation weight is larger than the other five weights combined. Under the same small percentage movement assumption, that makes its contribution larger than any single smaller component. This is a feature of the benchmark’s composition.
3. Does DXY include the Indian or Pakistani rupee?
No. INR and PKR are outside the six-currency basket. Use a directly identified USD/INR or USD/PKR series for the relevant rupee, with its source and timestamps. DXY cannot serve as either pair’s conversion rate.
4. Do DXY weights change with current trade patterns?
DXY uses fixed weights, so its basket does not automatically track changes in current trade shares. The Federal Reserve’s broad dollar index has a different trade-weighting framework. Check which benchmark you need before treating the two as substitutes.
5. Does an index reading above 100 mean the dollar is overvalued?
No. It places the index above its historical base level. Valuation is a separate analytical question requiring a stated model and assumptions. The base alone supplies no fair-value estimate.
6. Can DXY rise while EUR/USD also rises?
Yes, if movements in the remaining components more than offset the euro’s opposing contribution. The euro has substantial weight, but the index still incorporates all six currencies. Check a common observation window before drawing that conclusion.
7. Is a one-point DXY move always a 1% move?
Only when the starting level is 100. Percentage change equals the point change divided by the starting level, multiplied by 100. The same point change represents different percentages at different starting values.
8. Why might two dollar-index charts show different values?
Check the exact index or contract, observation time, timezone, delay, and treatment of continuous futures. A matching short label is insufficient to establish that two charts display the same measurement.
9. Can DXY alone explain a gold-price movement?
No single index observation establishes that explanation. Identify gold’s currency and unit, align the time window, and examine other relevant evidence. A relationship observed in one period does not guarantee the same result in another.
10. What should I save with a dollar-index screenshot?
Save the series name, provider, date, timezone, comparison window, and displayed units. Add the original link when available. These details make the observation easier to reproduce after the chart has updated.
Keep the basket attached to the headline
The useful habit is simple: name what the index covers every time the scope matters. DXY provides a defined six-currency comparison. Pair-specific research, local-currency conversions, and wider trade-weighted analysis each require their own matching evidence.
This article is educational and does not provide investment or trading advice. All numerical scenarios are hypothetical.