

CrowdSent Blog Team · Gold research
Understanding what affects gold prices starts with identifying which price you are reading. A dollar benchmark, an Indian rupee quote per 10 grams and a Pakistani rupee quote per tola describe different comparisons. After matching the quote, investigate interest rates, currencies, uncertainty, buying activity and physical supply using evidence from the same period.
This guide helps you build a defensible explanation for an observed change. The aim is to decide which claims the evidence supports, which comparisons need adjusting and what remains unknown. It provides a research process rather than a gold price forecast.
1. Identify the gold quote before explaining its movement
Write down the provider, currency, weight unit, purity, timestamp and quote type. Is it an auction benchmark, a continuously updated indication, a dated futures contract or a dealer’s selling price? Record whether a displayed figure is delayed. A price without these details is a weak starting point for comparison.
The LBMA’s benchmark explanation identifies its gold auction price as a London-delivered benchmark set in US dollars per troy ounce, with auctions twice daily. Use that description to identify the series. It does not make every website labelled “gold price” the same source or observation.
Make INR and PKR comparisons explicit
For a quote in India, check whether the displayed amount is INR per gram or per 10 grams and which purity it describes. For a quote in Pakistan, check whether it is PKR per tola or another unit, and retain the provider’s stated weight convention. The abbreviation “Rs” alone leaves the currency ambiguous.
A basic conversion starts with the dollar price per troy ounce, multiplies by local currency units per dollar and divides by about 31.1035 grams. Multiply by the desired number of grams. This produces a comparable metal-value reference before any product-specific adjustments; it does not reproduce a retail invoice.
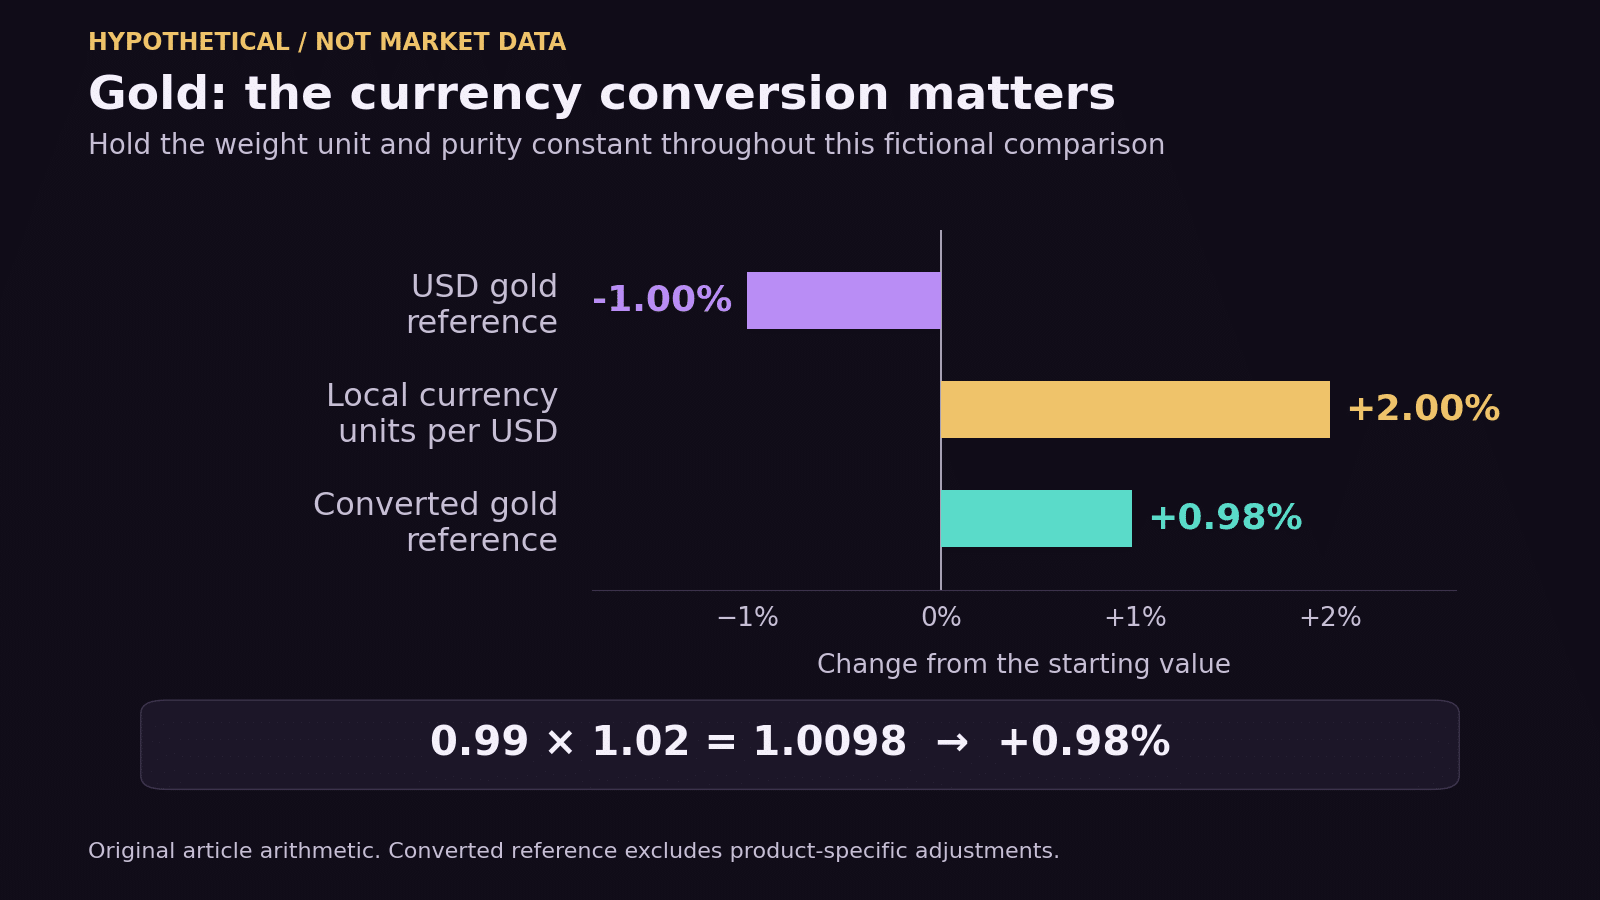
Hypothetical example: hold the unit and purity constant. If the dollar gold reference falls 1% while local currency units per dollar rise 2%, the converted reference rises about 0.98%: 0.99 multiplied by 1.02 equals 1.0098. Both observations can be correct. The figures illustrate arithmetic, not current INR or PKR conditions.
2. Check rates, inflation and the currency together
Gold pays no interest itself, so the return available on interest-bearing alternatives is relevant to its opportunity cost. Inflation expectations and currency movements also matter. The World Gold Council’s gold-driver framework treats these as interrelated influences alongside spending, risk, investment flows and supply. It does not reduce gold to one permanent relationship.
For a specific announcement, save the actual release and identify what was new. A policy rate, a market bond yield and an expectation about future rates are different observations. If your source uses a real yield, record how it measures inflation adjustment and the maturity of the instrument.
- Name the rate series rather than writing only “rates rose.”
- Record the release time and compare observations from consistent windows.
- Keep the currency measure explicit: a broad dollar index differs from USD/INR or USD/PKR.
- Retain evidence that challenges your explanation, including another relevant series moving differently.
For readers in India or Pakistan, US economic releases can be useful global reference points without being the whole local explanation. Keep the local currency conversion in the research note. Do not assign a local quote’s entire change to an overseas announcement merely because the timing looks convenient.
3. Test a risk-event explanation against the timeline
Headlines often connect gold with geopolitical or financial uncertainty. To investigate one of those explanations, reconstruct the sequence: when the event occurred, when reliable information became public, when the article appeared and which price interval it describes. A later story can summarise an earlier movement without establishing its cause.
Use the market news verification guide to locate the original announcement and check whether a dramatic headline preserves its qualifications. Save a short factual description before recording the author’s interpretation. Several reports repeating one anonymous claim do not give you several independent confirmations.
Hypothetical example: a report published at 15:00 attributes a morning rise to a statement first released at 14:00. Your selected morning window ends at 12:00. That statement cannot explain the earlier interval on the evidence recorded. You would need a verified earlier disclosure or a different explanation; speculation about a leak is not a substitute.
Write down one plausible competing account, such as a currency change or another scheduled release. You need not settle every influence. You do need to avoid treating a compelling narrative as demonstrated causation.
4. Ask what the evidence about gold buyers actually measures
A claim that “buyers are returning” needs a named group, measure and period. Central-bank purchases, exchange-traded fund flows, retail bar demand and online enthusiasm are different evidence categories. Identify which one the source reports before using the claim to explain a price movement.
The World Gold Council’s Q2 2026 demand report provides a useful real example of mixed categories: it reports central-bank buying alongside gold ETF outflows during the quarter. It also distinguishes jewellery spending from the quantity purchased. These categories can move differently in the same period.
Check whether a holdings figure describes metal quantity or its monetary value. An increase in value alone does not establish that more metal was acquired. Likewise, distinguish a survey about intended purchases from reported completed activity. Keep estimates and later revisions visible in your notes.
A quarterly total is background for a quarterly question. It does not reveal which participant set a particular minute’s price. Before moving between those timescales, state what extra evidence would be necessary and whether you have it.
5. Separate jewellery, mine supply and recycling evidence
The demand report also records mine production and recycled gold separately. Those measures help you ask more precise questions about physical supply. On the demand side, distinguish an increase in jewellery expenditure from an increase in gold weight: higher spending can coexist with a smaller quantity purchased.
For a regional demand story, note the market covered, the reporting period and the unit. A report about Indian jewellery spending does not automatically describe Pakistan, global retail demand or industrial use. If someone extends a local observation globally, look for the additional evidence supporting that extension.
Hypothetical example: a fictional shop reports that gold-jewellery revenue increased while grams sold decreased. That supports a statement about this shop’s revenue and volume. It does not establish more physical gold buying across the country. Product mix, price and coverage would need separate checks.
When reading a supply headline, ask whether it concerns an announced project, operating production, refined output or material actually offered in the relevant market. Record the document’s own category rather than changing every number into “available gold.” Keep a delayed annual estimate separate from an immediate disruption report.
6. Write a conclusion that fits your evidence
Finish with a short explanation of what affects gold prices in the interval you studied, while preserving the unresolved parts. A useful conclusion names the quote, summarises the strongest evidence and says where attribution remains tentative. You do not need to choose one cause simply to make the note sound decisive.
- Observed: which comparable price changed and over what interval.
- Supported context: the verified release, currency change or reported demand measure.
- Interpretation: the connection you think is plausible, clearly marked as your inference.
- Limit: mismatched timing, missing data or an alternative you cannot rule out.
- Next check: the specific source or revision that could resolve the gap.
Use a market research journal entry to retain that distinction. When comparing discussion around two gold events, the same discipline applies to historical sentiment comparisons: match the windows and source selection before interpreting a difference. Preserve your initial note and add a dated correction when necessary.
Worked case: reconcile two gold quotes without over-explaining the gap
Every provider, price and observation below is fictional. This example asks why two displayed gold quotations differ at one point in time. It does not measure a price change, identify a fair purchase price or reproduce a current Indian market quotation. Keep that question separate from an investigation of what affects gold prices over several days.
Preserve the two original records
- Quote A: Fictional Reference A displays USD 4,000 per fine troy ounce for a London metal reference. Its observation time is 10:00 UTC on the fictional study day. “Fine” refers to the gold content. This is a research reference, not an executable offer.
- Quote B: Fictional Seller B displays INR 110,000 for a 10-gram item with stated fineness of 0.916. Its observation time is 15:30 in Asia/Kolkata on the same day. It is an advertised seller’s asking price and includes fabrication, without a separate breakdown. Other charge components are unspecified.
- Supporting currency input: A fictional currency record shows INR 90 for USD 1 at 10:00 UTC. The direction is rupees per dollar. This is another research input, not a promise that anyone can exchange currency at that rate.
- Evidence retained: Save each source identifier, the relevant screenshot and its access time. Keep the displayed observation times separately. Here, all screenshots are collected at 10:10 UTC; that collection time does not replace the observations.
Align the fields and show the calculation
Quote B’s 15:30 India time corresponds to 10:00 UTC, so the stated observation times align. The 10-gram item contains 9.16 grams of fine gold under the example’s stated fineness. Use that content, rather than treating the entire item as 10 grams of pure gold.
Convert Quote A into rupees per gram of fine gold: USD 4,000 multiplied by INR 90 per dollar, divided by 31.1034768 grams per troy ounce. Multiply the result by 9.16 grams. The comparable metal-content reference is approximately INR 106,020.
The displayed item price is approximately INR 3,980 above that calculated reference, or 3.75% of the reference. Retain the unrounded inputs for calculation and round the reported result. This residual difference has not been explained: the records still differ in location, quote type and included fabrication.
Leave unresolved mismatches visible
If Seller B’s time were merely a page-update time, the apparent alignment would be unverified. Mark the actual observation time unknown and seek a time-matched quote. If fineness were missing, pause the fine-content calculation. If a Pakistani quote used PKR per tola, record its stated gram weight and use a matching PKR currency input before attempting the same comparison.
Do not fill a missing fabrication breakdown with an assumed percentage. Nor should you label the full gap a seller premium, currency effect or sign of stronger demand. Each description would require evidence beyond the arithmetic.
Frequently asked questions about what affects gold prices
Is there one main factor that always determines gold prices?
No single explanation should be assumed for every interval. Start with the quote and period, then compare the evidence for rates, currencies, buying activity, risk and physical conditions. If you cannot distinguish several plausible explanations, state that limit rather than assigning an unsupported percentage of the movement to each one.
Does higher inflation automatically make gold rise?
An inflation figure alone is insufficient to establish a price direction. Record the measure, reporting period, release time and any evidence about prior expectations. Then examine the relevant rate and currency observations. A headline saying inflation is high does not show what changed during your selected gold-price window.
Why can a rupee gold quote rise while a dollar quote falls?
The conversion can change at the same time as the dollar metal reference. Confirm whether you mean INR or PKR, use local currency units per dollar and match timestamps. Then check weight, purity and quote type. The worked example above isolates currency arithmetic; an actual retail quote can contain further components.
Can I compare a 22-karat quote directly with a 24-karat quote?
Record the stated purity and fine-metal content before comparing them. A lower-purity item and a higher-purity reference do not contain identical amounts of gold for the same gross weight. Also retain making charges and other disclosed invoice components separately. A purity calculation alone does not establish the final purchase or resale price.
Are jewellery prices the same as a benchmark gold price?
A benchmark identifies a specific market reference. A jewellery quotation describes a particular product and may include separately stated work, design or other charges. Ask what the quoted amount covers and which weight it uses. Compare the metal reference and the complete product quotation as distinct records.
Does a central bank’s higher gold reserve value prove it bought gold?
Check the quantity series and the valuation basis. A reserve value can change even when the recorded physical quantity does not. Read the original release for transfers, valuation changes or revised figures before describing the observation as a purchase. Keep reported holdings and estimated market demand separately labelled.
How do I investigate a claim that gold is a safe haven?
Turn the label into a testable question: which event, currency and observation window does the claim concern? Inspect the original event source and the comparable gold series. A description of why some people hold gold does not establish that its price must rise during every period of uncertainty.
Should I use daily prices or monthly averages?
Choose the frequency that matches the question before looking for a convenient result. A monthly average may suit comparison with monthly background data but cannot locate an intraday response. Retain the aggregation rule and publication lag. Avoid silently switching from a daily observation to a monthly average midway through the comparison.
Can online gold sentiment identify the cause of a price move?
Discussion can reveal which explanations people are repeating. It does not independently confirm those explanations or identify all market participants. Keep the sources, collection window and repeated posts visible, and verify the underlying claims separately. A more enthusiastic conversation is an observation about that conversation until stronger evidence supports a broader claim.
What should I do when the available evidence does not explain the move?
Close the note with the observation, the checks completed and the missing evidence. An unresolved explanation is a valid research outcome. Name the event that would justify revisiting it, such as a corrected release or an accessible historical series. Avoid filling the gap with a confident story that cannot be checked.

Source documentation checked 7 October 2026. Educational research guidance from the CrowdSent Blog Team. Examples labelled hypothetical are invented and are not current market observations. This article does not provide investment recommendations.