

Tracking error vs tracking difference separates the variability of periodic benchmark-relative returns from the performance gap over a stated holding period. A fund can have a constant negative return gap and zero measured tracking error. The two statistics answer different questions and need separate formulas.
Our original four-quarter example makes that distinction visible. Two fictional funds finish the year with nearly equal benchmark-relative results, while their tracking-error calculations differ. The observations are invented and are too few to represent a reliable real-world risk estimate.
Tracking error vs tracking difference starts with a signed gap
The CFA Institute’s public ETF mechanics summary distinguishes holding-period tracking differences from the variability of daily return differences. SEBI’s May 2022 passive-funds circular, pages 9–10, also identifies these as separate measures.
For this worksheet, active return means fund return minus benchmark return for one quarter. A positive number means the fictional fund’s return is higher for that quarter. A negative number means it is lower. Other documents can adopt a reversed difference convention, so copy the formula with the label.
Here, tracking difference is the fund’s full-year compounded return minus the benchmark’s full-year compounded return. Tracking error is the sample standard deviation of quarterly active returns, followed by a separately stated illustrative annualization. This quarterly classroom calculation is not the circular’s daily-data disclosure calculation.
Build two paths with the same mean quarterly gap
Assume the benchmark returns 1.00% in each of four quarters. Fund A returns 0.90% every quarter. Fund B alternates between 0.70% and 1.10%. All three series use matching currency and distribution-inclusive return definitions, with no personal deposits or withdrawals.
On a narrow screen, scroll the table sideways to read every column.
| Quarter | Benchmark | Fund A | A minus benchmark | Fund B | B minus benchmark |
|---|---|---|---|---|---|
| 1 | 1.00% | 0.90% | −0.10 | 0.70% | −0.30 |
| 2 | 1.00% | 0.90% | −0.10 | 1.10% | +0.10 |
| 3 | 1.00% | 0.90% | −0.10 | 0.70% | −0.30 |
| 4 | 1.00% | 0.90% | −0.10 | 1.10% | +0.10 |
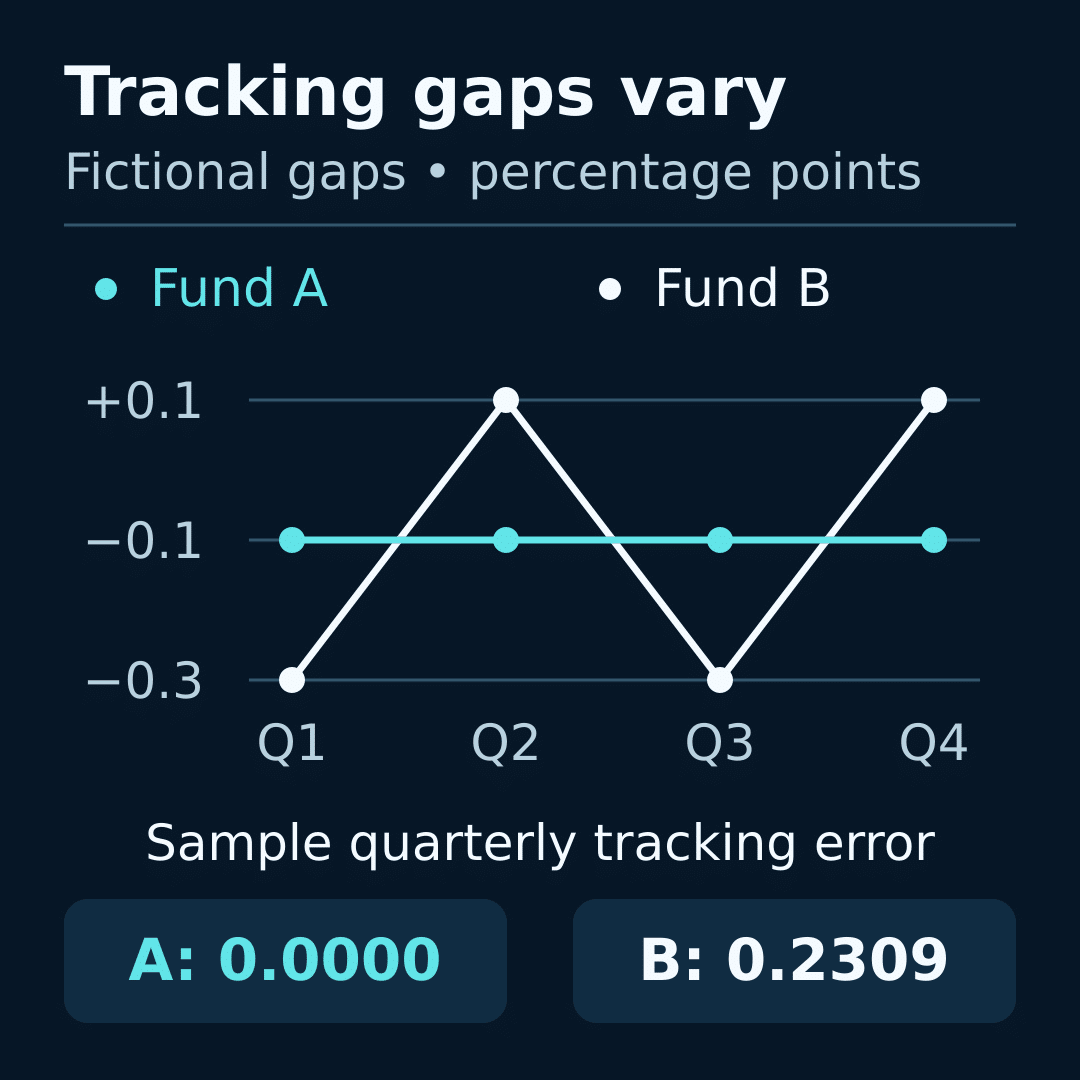
Fund A’s mean active return is −0.10 percentage point. Fund B’s gaps sum to −0.40, which divided by four also gives −0.10. Equal means do not make the paths identical: A’s gap is constant, while B’s moves above and below that mean.
Compound each series before calculating tracking difference
Convert each quarterly return into a growth factor. The benchmark’s four factors are all 1.01, giving 1.01⁴ − 1 = 4.060401% over the year. Fund A uses 1.009⁴ − 1, giving 3.6488922561%.
Fund B’s factors are 1.007, 1.011, 1.007 and 1.011. Their product minus one gives 3.6480777929%. The order and inputs remain visible even though regrouping these four multiplications produces the same final product.
Subtract the benchmark’s full-year return from each fund’s full-year return. Fund A’s tracking difference is 3.6488922561% − 4.060401% = −0.4115087439 percentage point. Fund B’s is −0.4123232071 percentage point.
The two gaps are very close, but they are not exactly equal. Multiplying the mean quarterly active return by four would produce −0.40 percentage point for both funds. That shortcut misses the compounding in each independent return path.
A balance check makes the result concrete. Starting each series at a hypothetical 10,000 gives year-end values of 10,406.0401 for the benchmark, 10,364.88922561 for A and 10,364.80777929 for B. The fund-minus-benchmark differences are approximately −41.15 and −41.23 currency units.
Measure how the quarterly gaps vary around their mean
For Fund A, every active return equals the mean of −0.10. Subtracting that mean from each observation leaves four zeros. Their sample standard deviation is zero. The calculation records constant underperformance across these observations, rather than an absence of underperformance.
For Fund B, subtract −0.10 from each active return. The deviations become −0.20, +0.20, −0.20 and +0.20 percentage point. Squaring each gives 0.04 in squared percentage-point units. Their sum is 0.16.
Our chosen sample convention divides by n − 1. With four observations, divide 0.16 by three, then take the square root: √(0.16 ÷ 3) = 0.2309401077 percentage point per quarterly observation interval.
For illustration, apply the conventional square-root-of-frequency scaling: multiply by √4, or two. Fund B’s annualized tracking-error figure becomes approximately 0.4618802154%; Fund A’s remains zero. The scaling convention needs justification for the data process and does not turn four invented observations into a stable forecast.
Using a population denominator of four would instead produce a quarterly standard deviation of 0.20. That is a different convention, not evidence that the sample calculation failed. A published statistic needs its observation frequency, window, denominator and annualization method attached.
Check the return series before interpreting either result
Match dates, currency, benchmark version and treatment of distributions. For an ETF, identify whether the fund series uses NAV or exchange prices. A changed series definition can alter the answer even when the spreadsheet formulas stay unchanged.
The CFA summary identifies expenses, representative sampling, index changes and operational differences among possible reasons for tracking gaps. These are hypotheses to test against records. Our synthetic numbers specify no cause, so attributing Fund A’s constant gap entirely to fees would invent evidence.
If one quarter is absent, keep it marked as missing. Substituting a zero fund return while retaining the benchmark’s 1% would manufacture a −1 percentage-point gap. Check the currency labels and preserve the full input series in a research journal.
Frequently asked questions
Can tracking error be zero while a fund trails its benchmark?
Yes. Fund A’s active return is −0.10 percentage point in every quarter. There is no variability around that mean, so measured tracking error is zero. Its compounded annual return still trails the benchmark by about 0.4115 percentage point.
Why does the standard-deviation denominator change the result?
Fund B’s squared deviations sum to 0.16. The sample convention divides by three before taking the square root, giving 0.23094; the population convention divides by four, giving 0.20. Both describe a stated calculation. Record the denominator rather than treating the two conventions as interchangeable.
Why might two documents show opposite signs for the same gap?
One may subtract the benchmark from the fund while the other subtracts the fund from the benchmark. Reproduce their inputs and formulas before calling the figures inconsistent. A matching absolute amount does not establish that both documents use the same definition.
Is tracking error the same as the fund’s own volatility?
This worksheet calculates variability in fund-minus-benchmark returns. It does not calculate variability of the fund returns alone. Keeping the active-return column explicit makes that distinction auditable and prevents using the wrong series inside the standard-deviation formula.
Why isn’t mean quarterly active return the annual tracking difference?
The mean summarizes quarterly gaps arithmetically. Our annual tracking difference first compounds the two return series separately. Fund A illustrates the distinction: four times −0.10 is −0.40, while its compounded annual gap is approximately −0.4115 percentage point.
Does the expense ratio alone explain tracking difference?
Our return ledger cannot establish the cause of its gaps. An expense figure may be relevant, but assigning the entire result to it needs supporting evidence about the measurement period and other differences. Keep arithmetic reconciliation separate from causal attribution.
Will changing the observation frequency preserve tracking error?
Do not assume so. Quarterly, monthly and daily calculations use different observations and may require different scaling assumptions. Our 0.23094 quarterly sample result is meaningful only with its four-row series and stated denominator.
Must ETF market-price tracking match NAV tracking?
They use different fund-return inputs. Calculate and label them separately if both matter to the research question. Replacing a NAV series with exchange prices halfway through the window would change the measurement without clearly identifying what was changed.
Does low tracking error rule out losing money?
A relative-gap statistic cannot establish that. Imagine identical negative fund and benchmark returns in every period: their active gaps would be zero while both series declined. Tracking error describes variation relative to the benchmark, not a lower bound on fund returns.
Which benchmark details should accompany the calculation?
Keep the benchmark’s full name, return variant, currency, dates and distribution treatment, alongside the fund series and observation frequency. Those details let another reader reconstruct the comparison and distinguish a changed input definition from a changed tracking result.
Educational explanation by the CrowdSent Blog Team. Sources checked 13 October 2026. All figures are hypothetical and are not fund-selection recommendations.