

By CrowdSent Blog Team
The stochastic oscillator measures where a closing price sits within a recent high-low range. Its basic calculation converts that position to a scale from zero to 100. A reading near 100 places the close near the top of the selected interval; a reading near zero places it near the bottom.
That description is narrower than many chart captions suggest. The number is not a probability, and the familiar “overbought” or “oversold” labels do not require an immediate reversal. To read the oscillator carefully, separate the raw range-position calculation from its smoothing and from any interpretation added afterward.
All examples are hypothetical. This guide explains data and arithmetic and does not provide a trading recommendation.
What does the stochastic oscillator calculate?
Begin with three values: the current close, the highest high in the chosen lookback, and the lowest low in that same lookback. The raw %K calculation is 100 × (close − lowest low) ÷ (highest high − lowest low).
The numerator measures the close’s distance above the interval’s bottom. The denominator measures the interval’s full width. Their ratio expresses a location within that range. This is why raw %K is zero at the lowest low, 50 at the midpoint and 100 at the highest high, provided the interval has a positive width.
MetaTrader’s stochastic oscillator reference documents this base formula and the separate inputs for lookback, slowing, %D length and averaging method. A chart labeled only “stochastic” can therefore leave important choices unspecified.
The lookback contains highs and lows, not just closes
The highest high and lowest low can occur on different bars. They are the extremes of the complete lookback interval, which normally includes the current bar. Using the maximum and minimum closing prices instead would construct a different denominator from the high-low version explained here.
For example, a bar with a high of 110 might close at 103. The high still matters while that bar remains inside the lookback. Removing it merely because the close was lower changes the calculation and can make a worksheet disagree with the chart.
Calculate a raw %K reading step by step
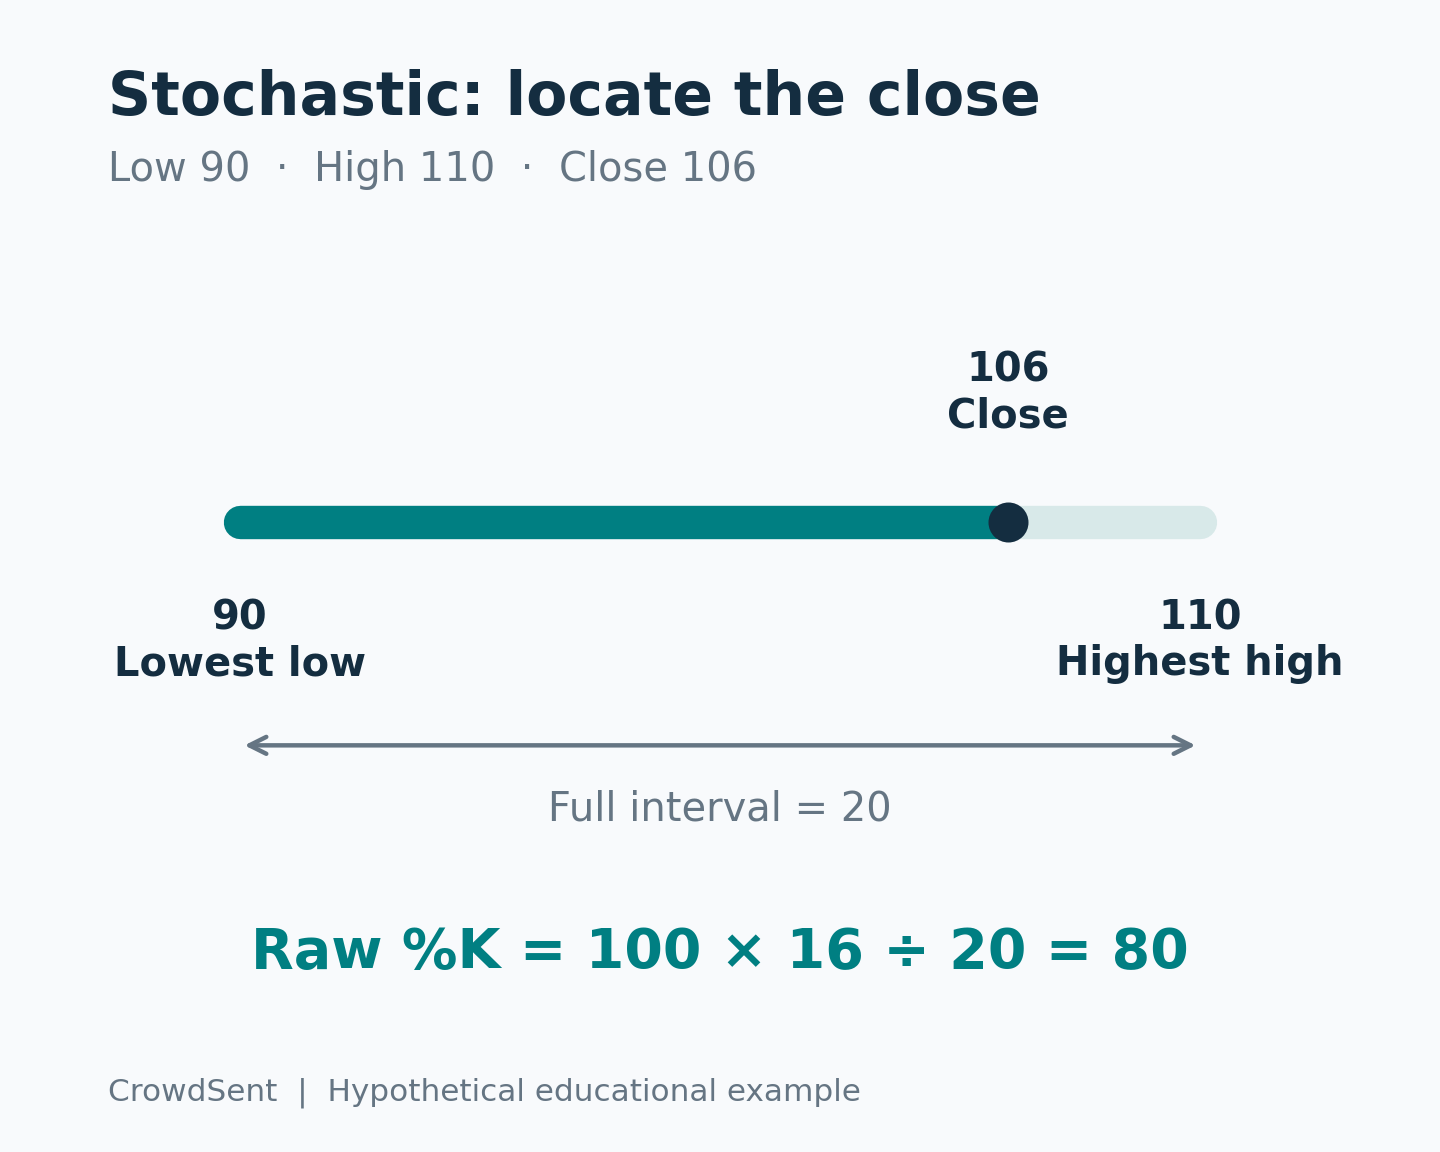
Suppose the highest high across a hypothetical fourteen-bar window is 110, the lowest low is 90, and the current close is 106. The close is 106 − 90 = 16 units above the bottom. The full interval is 110 − 90 = 20 units wide.
Raw %K is therefore 100 × 16 ÷ 20 = 80. The close sits four-fifths of the way from the bottom to the top. It does not follow that the asset rose 80%, that 80% of participants are buyers, or that there is an 80% chance of a decline.
If the close were 94 with the same high and low, raw %K would be 100 × 4 ÷ 20 = 20. If it were 100, the result would be 50. Holding the reference interval constant makes the relationship between closing location and indicator value easy to inspect.
A stable close can produce a changing oscillator
The reference interval does not remain constant forever. Consider a short rolling window whose high is 110, low is 90 and current close is 100. Raw %K is 50. On the next bar, suppose the old 110 high leaves the window, the remaining highest high is 105, the lowest low stays 90, and the new close is again 100.
The updated value becomes 100 × (100 − 90) ÷ (105 − 90) = 66.6667. The closing price did not increase. The indicator rose because the top of its reference interval fell.
This is a useful audit example because it prevents an overly simple reading of slope. An upward move in the oscillator can reflect a higher close, changed range endpoints, or some combination. Inspect the rolling window before attributing every change to new upward price momentum.
How fast, slow and full stochastic differ
The raw calculation can fluctuate as closes and range endpoints move. Charting implementations often smooth it. In a common fast-stochastic convention, Fast %K is the raw value and Fast %D is a moving average of those raw values.
In a common slow-stochastic convention, Slow %K is itself a moving average of raw %K, and Slow %D is another moving average of Slow %K. Full stochastic exposes the lookback and smoothing lengths as configurable inputs. StockCharts’ fast, slow and full stochastic documentation explains these distinctions.
A small smoothing example
Suppose three consecutive raw %K readings are 60, 80 and 100. With a three-value simple average, the latest Fast %D is (60 + 80 + 100) ÷ 3 = 80. A three-value Slow %K based on the same raw sequence is also 80 under this convention.
Now suppose the last three Slow %K observations are 70, 75 and 80. Their three-value simple average gives Slow %D = (70 + 75 + 80) ÷ 3 = 75. The displayed slow pair would therefore be %K 80 and %D 75. The earlier slow values are assumed illustrative inputs, not values derived solely from the three raw observations shown.
The distinction prevents a common reconstruction error. The latest three raw readings are sufficient for one three-value average. They are not sufficient to calculate a second-stage three-value average without the earlier first-stage values.
Read settings by their field labels
A tuple such as 14, 3, 3 often refers to a fourteen-bar range with smoothing lengths of three, but input ordering and available methods depend on the platform. Read the named fields rather than transferring three unlabeled numbers between applications.
TradingView’s STOCH documentation writes its displayed %K as a simple average of the raw range-position ratio and %D as another simple average. MetaTrader’s reference exposes additional averaging-method choices. Identical numerical lengths do not settle every implementation detail.
How to read high and low values without overclaiming
The familiar reference levels of 80 and 20 divide the range-position scale into upper and lower regions. In the raw calculation, 80 places the close near the upper fifth of the interval, while 20 places it near the lower fifth. For a smoothed series, the displayed value summarizes several recent range positions instead.
The terms “overbought” and “oversold” are traditional chart labels. They are not direct measurements of valuation, investor crowding, order-book imbalance or the number of willing buyers and sellers. If the research question concerns sentiment, use evidence designed for that question, such as the source and methodology checks in CrowdSent’s sentiment-score guide.
A simple constructed example shows why a high reading can persist. Imagine several successive windows, each ending with a close at its own highest high. Raw %K is 100 in each window even if the absolute price keeps rising. The formula contains no countdown requiring that reading to fall after a specified number of bars.
Crossovers and divergences are observations first
A %K/%D crossover records a change in the ordering of two related series. Because one is smoothed from the other or from shared inputs, the lines are not independent measurements. Describe the crossing, its timestamp and the completed-bar status before attaching a forecasting claim.
A divergence compares selected price highs or lows with selected oscillator highs or lows. The choice of comparison points matters. A reproducible note states which bars were selected and whether the same lookback and smoothing were used throughout. Otherwise, changing the endpoints after seeing the outcome can make a pattern appear more convincing than the original evidence warrants.
Neither observation alone establishes why price moved. If a market story is part of the explanation, separately verify the news and its timing rather than treating the shape of an oscillator as proof of a cause.
Data checks before comparing two readings
Match the instrument, venue, bar duration, session boundaries and price fields. Then match the lookback, %K slowing length, %D length and averaging method. Confirm both observations refer to the same completed bar. A live high, low or provisional close can change while the current bar is still forming.
Data quality is particularly important for extremes. One incorrect high can remain the highest value in the window for many bars, compressing raw %K readings until it leaves. One incorrect low can have the opposite effect. A missing observation treated as zero is therefore more than a cosmetic chart gap.
Before correcting such a discrepancy, preserve the source and the original values. CrowdSent’s missing-data guide explains why a zero and an unavailable observation need different treatment. Resolve the input problem before concluding that platforms use different mathematics.
Frequently asked questions about the stochastic oscillator
1. What does a stochastic reading of 80 mean?
For raw %K, it means the close lies 80% of the distance from the window’s lowest low to its highest high. A smoothed %K or %D reading of 80 instead averages recent range positions. Check which line the number belongs to.
2. Is %D always a three-period simple average?
Three is a common choice, but lengths and averaging methods are configurable in some implementations. A screenshot should identify the %D settings. Assuming a default can prevent an otherwise correct worksheet from matching a customized chart.
3. Why are fast and slow stochastic values different?
The slow version adds smoothing to the raw %K sequence before calculating its companion line. This changes how quickly the displayed values respond. The difference is expected when the smoothing stages differ, even if both versions use the same high-low lookback.
4. Can the oscillator change when the close stays unchanged?
Yes. An old high or low can leave the rolling window, changing its reference interval. The example with an unchanged close of 100 moved raw %K from 50 to about 66.67 solely because the highest high fell from 110 to 105.
5. Does an overbought reading require a price decline?
No. A close can remain near successive window highs while prices continue rising. The label describes a relative position under the chosen calculation. It does not impose a time limit or create a mandatory reversal in the underlying price series.
6. What happens when the highest high equals the lowest low?
The raw formula has a zero denominator and is undefined. This can occur in a completely flat window. Software must apply a special rule or return missing data; record its behavior rather than assuming every platform displays the same replacement value.
7. Can raw %K exceed 100?
With valid, consistent data and a window that includes the current bar, its close should lie within the selected high-low interval. An out-of-range raw value calls for checking mismatched sources, shifted windows or a different indicator definition before interpreting it.
8. Is stochastic RSI the same indicator?
No. Stochastic RSI applies a range-position calculation to an RSI series rather than directly locating a closing price within price highs and lows. The shared word “stochastic” does not make their input data or resulting values interchangeable.
9. Does a daily stochastic calculation use calendar days?
It uses the daily bars supplied by the selected dataset. A fourteen-bar equity window and a fourteen-bar continuously traded market can cover different elapsed calendar periods. Session and holiday treatment should be part of the comparison.
10. What should a reproducible stochastic note contain?
Record the source, symbol, interval, session, lookback, price fields, smoothing stages, averaging methods and timestamp. Include the raw high, low and close for at least one check. Distinguish a live provisional reading from a completed-bar observation.
Conclusion: follow the close and its reference interval
The stochastic oscillator becomes easier to explain when the range endpoints stay visible. Calculate the raw position first, identify every smoothing stage, and check whether a changing reading came from the close, the window or both. This produces a precise description of recent price location without turning traditional chart labels into promises about future returns.
Source documentation checked 11 October 2026. Educational explanation from the CrowdSent Blog Team. Numerical examples are hypothetical unless explicitly identified otherwise. This article does not provide investment recommendations.