

The RSI indicator compares the size of recent upward and downward price changes after smoothing them. It converts their relationship into a reading between 0 and 100. The number is a summary of the chosen price sequence, not the percentage of market participants who are optimistic or the probability of a future rise.
Understanding that construction helps when two charts disagree, when an extreme reading persists, or when a headline treats “overbought” as a complete conclusion. We will calculate a short RSI by hand, separate the measurement from its common labels, and build a record another reader can check.
All prices are hypothetical units. No particular stock, currency or cryptoasset is being evaluated, and the example length is chosen for transparent arithmetic rather than as a recommended setting.
How the RSI indicator is calculated
RSI stands for relative strength index. In its familiar form, it uses successive closing-price changes. For each change, put a positive movement in a gain column and a negative movement’s absolute size in a loss column. The other column receives zero. An unchanged close contributes zero to both.
Smooth the two columns separately. Call their results average gain and average loss. Their ratio is RS = average gain ÷ average loss. Then RSI = 100 − 100 ÷ (1 + RS). When the denominator is valid, an equivalent expression is 100 × average gain ÷ (average gain + average loss).
TradingView’s RSI documentation shows this separation and the use of Wilder-style smoothing for gains and losses. The calculation concerns the instrument’s own changes. It does not compare the instrument with an index, despite the words “relative strength” in its name.
Because gains and losses use the same units, those units cancel in their ratio. An RSI value of 60 is a dimensionless index reading. It is not a 60% price increase, a sentiment survey result or a statement about the asset’s intrinsic value.
Build the first reading from six closes
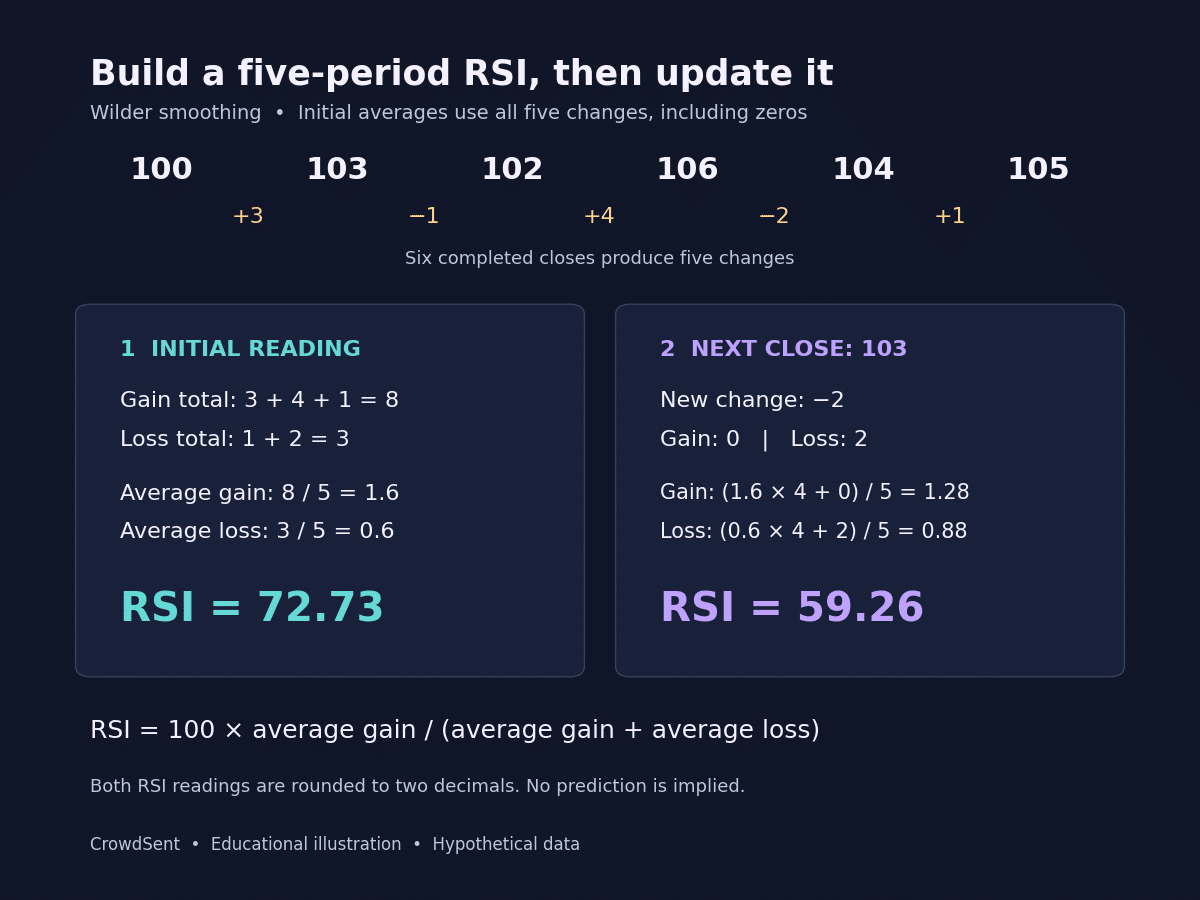
Use a five-period example with six completed closes: 100, 103, 102, 106, 104 and 105. Six prices are needed to produce five consecutive changes. Label the observations 0 through 5 so the first close is clearly a starting reference.
- 100 to 103: change +3; gain 3; loss 0
- 103 to 102: change −1; gain 0; loss 1
- 102 to 106: change +4; gain 4; loss 0
- 106 to 104: change −2; gain 0; loss 2
- 104 to 105: change +1; gain 1; loss 0
The total gain is 8 and the total loss is 3. For the initial seed, divide both totals by all five changes. Average gain = 8 ÷ 5 = 1.6. Average loss = 3 ÷ 5 = 0.6. Do not divide gains by the three rising observations or losses by the two falling observations; that would define a different statistic.
RS is 1.6 ÷ 0.6, or 2.6667 when rounded. RSI is 100 − 100 ÷ 3.6667, approximately 72.73. Using the equivalent expression gives 100 × 1.6 ÷ 2.2 = 72.73.
The final price has risen 5% from 100 to 105. That return is different from the RSI reading of 72.73. The two numbers answer different questions: one compares endpoints, while the other compares the smoothed positive and negative changes along the path.
A second path can reach the same final close with different changes and a different RSI. Endpoint agreement therefore cannot validate an RSI calculation. Keep the intermediate observations when reproducing an example.
Apply Wilder smoothing to the next observation
Now add a seventh close of 103. The new movement from 105 is −2, so the new gain is 0 and the new loss is 2. For the five-period Wilder update, multiply each previous average by four, add the new component and divide by five.
New average gain = (1.6 × 4 + 0) ÷ 5 = 1.28. New average loss = (0.6 × 4 + 2) ÷ 5 = 0.88. The resulting RSI is 100 × 1.28 ÷ (1.28 + 0.88), approximately 59.26.
This is recursive smoothing. It is not the same as discarding the oldest change and recomputing a fresh five-change arithmetic average. That alternative would retain changes −1, +4, −2, +1 and −2, yielding gains of 5 and losses of 5, and therefore a reading of 50.
The thinkorswim Wilder-average reference specifies a smoothing coefficient of 1/n and an initial SMA. It also notes that initialisation can affect comparisons. A conventional EMA with coefficient 2/(n + 1) uses a different coefficient, even when the displayed length is the same.
If the next close remains 103, both components are zero. The averages become 1.024 and 0.704, respectively. Both shrink by the same factor of 0.8, so their ratio and the RSI remain unchanged at approximately 59.26. An unchanged RSI can therefore accompany an unchanged price without showing that the internal smoothed amounts stayed constant.
Read 30, 50 and 70 as descriptions
When average gain equals average loss and their sum is positive, RSI equals 50. When the gain component is three times the loss component, RSI equals 75. When the gain component is one-third of the loss component, RSI equals 25. These relationships follow from the formula.
The familiar labels “overbought” above 70 and “oversold” below 30 are conventional interpretations. Fidelity’s RSI guide describes those levels and warns that readings can remain in those regions for extended periods during strong trends. A label does not supply a deadline for a reversal.
For the example, 72.73 tells us that the initial average gain was about 2.67 times the initial average loss. It does not establish excessive valuation, identify forced participants or quantify the likelihood of tomorrow’s outcome. Those claims require evidence beyond this calculation.
A divergence description also needs precise endpoints. If price makes a higher selected high while RSI makes a lower selected high, record the actual dates and values. Choosing different peaks after seeing later prices can change the apparent pattern. Describing a mismatch is different from validating a forecasting claim about it.
Check whether an RSI difference comes from currency conversion
Multiplying every price by the same positive number should leave the illustrated RSI unchanged when the calculation uses the same observations, smoothing and consistently scaled starting values. Every gain and loss receives that multiplier, which cancels from their ratio. This follows directly from the RSI formula above.
Double the six example closes to 200, 206, 204, 212, 208 and 210. The five-period initial average gain doubles from 1.6 to 3.2, and average loss doubles from 0.6 to 1.2. RSI remains 100 × 3.2 ÷ (3.2 + 1.2), approximately 72.73.
A date-specific currency conversion is different because its multiplier can change. For a hypothetical counterexample, use a conversion factor of 2 for the first five original closes and 2.02 for the last. The converted closes become 200, 206, 204, 212, 208 and 212.1. Their gains total 18.1 and losses total 6, giving initial averages of 3.62 and 1.2. RSI becomes approximately 75.10.
The new reading reflects the changed converted-price path. If two RSI calculations disagree, first ask whether the histories differ only by a common scale factor or by changing conversion factors. Preserve full precision during the check; rounding converted prices before calculating changes can introduce another difference.
Match the period, seed and price history
A 14-period RSI on daily closes concerns fourteen changes for its initial full-window seed. A 14-period RSI on hourly closes concerns a different sequence. The number 14 alone does not identify the time covered. Market closures, absent bars and data filtering can also affect elapsed calendar time.
For readers in India or Pakistan comparing a domestic stock with an overseas listing, retain each instrument’s venue and daily-session definition. Local display time does not automatically redefine the provider’s daily close. Confirm the final completed bar before comparing screenshots.
Corporate-action treatment can alter the changes entering the gain and loss columns. An unadjusted split can create a large mechanical negative change. A consistently adjusted history may remove it. Dividend adjustments can change other movements. Keep the adjustment basis fixed and documented rather than selecting the version with the preferred visual result.
If one close is missing, the next observed difference may span more than one intended interval. Inserting a zero price creates a fictional collapse and recovery. Repeating the last close creates a different assumption. See missing market data versus zero before filling either kind of gap.
For an exact audit, export a small common sample and compare closes first, then changes, gain/loss columns, initial averages and recursive updates. Retain extra decimals internally and round only the displayed answer. If the raw inputs disagree, matching the final RSI by changing its settings is not a sound repair.
Keep the research claim within the measurement
RSI does not use volume in this standard construction. It cannot tell you how many accounts hold a view, how much depth is available or what caused the observed changes. Combining it with another series does not erase those limitations.
When comparing RSI with sentiment, use matching timestamps and clearly defined windows. The guide to reading historical sentiment explains why a later summary should not be treated as information available earlier. Keep the comparison descriptive until a separately designed test supports a broader claim.
A compact market research journal entry can retain the source, symbol, input field, timeframe, length, smoothing rule, seed, adjustment basis and observation date. Add the unrounded intermediate values for one checkable example. That record is more useful than a screenshot labelled only “RSI 14.”
Frequently asked questions
What does an RSI of 70 mean?
Under the standard formula, a reading of 70 implies the smoothed gain is about 2.33 times the smoothed loss, provided both are defined. It does not mean that 70% of investors are optimistic or that a decline is certain.
Does RSI measure the percentage change in price?
No. Price return compares endpoints using an initial price as denominator. RSI compares smoothed upward and downward changes. Our sequence rises 5% from its first to sixth close while its first five-period RSI is approximately 72.73.
Why do fourteen periods usually require fifteen starting closes?
Each change needs a current and a previous close. Fifteen consecutive prices provide fourteen changes. Software may already hold an earlier reference close outside the visible chart, so the visible bar count can look different.
Is Wilder smoothing the same as a standard EMA?
Both use a recursive weighted update, but the common coefficients differ. Wilder smoothing uses 1/n; a conventional n-period EMA uses 2/(n + 1). Equal length labels therefore do not guarantee equal numerical results.
Can RSI stay high while price continues to rise?
Yes. Repeated positive changes can keep the smoothed gain large relative to the smoothed loss. A high reading contains no countdown or required reversal date. Interpret the number with its defined window and completed-bar status.
What happens when the average loss is zero?
If the average gain is positive and average loss is zero, the standard limiting RSI value is 100. If both are zero, the ratio is undefined. Check the software’s convention for that completely flat case rather than assuming a universal answer.
Can a flat close change RSI?
Under the illustrated Wilder update, both positive existing averages shrink by the same factor after a zero change, leaving their ratio unchanged. Other smoothing or missing-data conventions can behave differently, so identify the actual implementation.
Does an RSI of 50 prove that price has gone nowhere?
No. It establishes equality of the two smoothed components when their sum is positive. Their weighting history can differ from the endpoints you are comparing. A flat net return is a separate calculation with a specified start and end.
Why does the rightmost RSI value keep moving?
Its source bar may still be forming. A changing current close alters the latest gain or loss and therefore the provisional RSI. Compare completed observations if you want a stable historical calculation.
How should I investigate two conflicting RSI readings?
Match the raw price series, source field, timeframe, adjustments and completed timestamp first. Then compare length, smoothing method, starting history and missing-data treatment. Inspect intermediate values before relying on a rounded final number.
Educational information only. All numerical examples are hypothetical. This article provides no investment recommendation or forecast.