

Profit factor vs payoff ratio compares two different ways of summarizing a trade ledger. Profit factor divides total winning amounts by total losing amounts. Payoff ratio divides the average winner by the average loser. The difference between totals and averages is the number of observations in each group.
Both figures can be useful descriptions of a historical sample, but neither is an account return or a complete risk measure. This guide shows how to reproduce them, combine subperiods correctly and identify situations where a neat-looking ratio hides a fragile denominator.
Write down both denominators before comparing the ratios
Let G be the sum of positive outcomes, D the absolute sum of negative outcomes, Nw the number of winners and Nl the number of losers. Use the same trade set, currency and cost convention throughout.
- Profit factor = G ÷ D.
- Average winner = G ÷ Nw.
- Average loser magnitude = D ÷ Nl.
- Payoff ratio = average winner ÷ average loser magnitude.
The loss magnitude is positive in these formulas. A ledger may display a gross loss of −$900, but the denominator of the ratio is $900. Keeping the negative sign would produce a misleading negative profit factor.
TradingView’s profit-factor definition uses realized winning and losing amounts, excluding open positions. Its strategy documentation also distinguishes average winning/losing trade ratios from gross profit/loss ratios. Here, “payoff ratio” always means the realized average-winner-to-average-loser ratio.
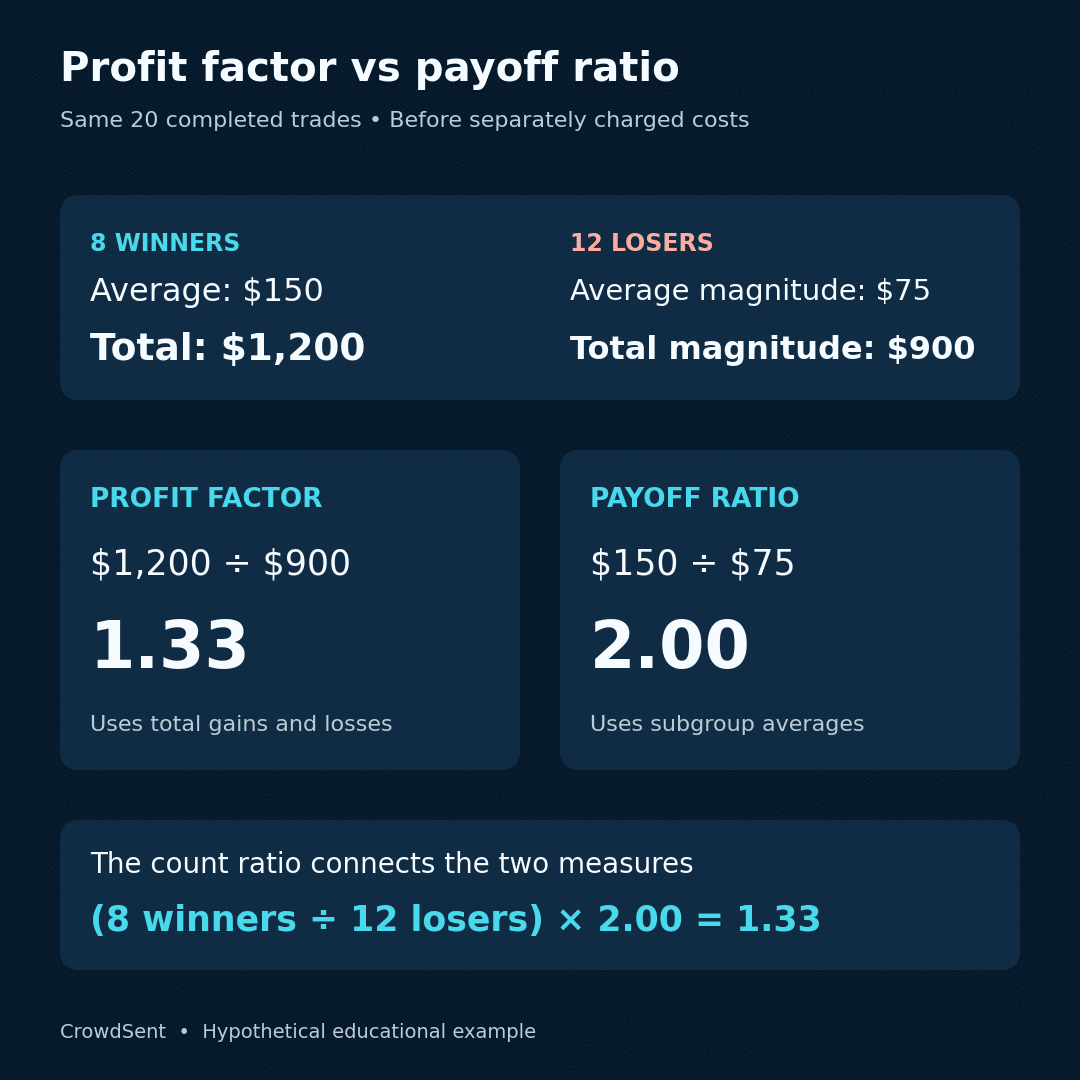
Hypothetical ledger: a payoff ratio of 2, a profit factor of 1.33
Imagine 20 completed trades, using outcomes before separately charged commissions. Eight winners average $150 and 12 losers average $75 in magnitude.
The winning total is 8 × $150 = $1,200. The losing total is 12 × $75 = $900. Profit factor is $1,200 ÷ $900 = 1.333, while payoff ratio is $150 ÷ $75 = 2.00.
These figures are consistent. The average winner is twice the average loser, but there are fewer winners. Total gains exceed total losses by $300 before the omitted charges. That $300 is a currency amount; 1.333 is a dimensionless ratio.
Now reconstruct the connection directly:
Profit factor = (Nw ÷ Nl) × payoff ratio.
For this ledger, (8 ÷ 12) × 2 = 1.333. If every nonzero observation belongs to one of the two groups, the same identity can be written as p/(1 − p) × payoff ratio, where p is the winning share among those nonzero observations.
Zero-result trades require care with that second expression. They do not contribute to G or D. If p instead uses all closed trades, including zeros, 1 − p includes both losers and zeros and is no longer the correct losing share.
A second ledger: smaller average winners, larger total gains
A separate hypothetical set contains 35 winners averaging $40 and 15 losers averaging $60. Gross gains are $1,400 and gross losses are $900.
The payoff ratio is $40 ÷ $60 = 0.667. Profit factor is $1,400 ÷ $900 = 1.556. The average winner is smaller than the average loser, but the greater number of winners creates a larger winning total.
Comparing these examples makes the distinction visible. The first ledger has the higher payoff ratio, while the second has the higher profit factor. Neither ranking tells us the time taken, the capital committed, the worst unrealized loss or the reliability of another sample.
The two ledgers also have different trade counts. Reporting “ratio improved” without naming the sample size and period would leave an important part of the comparison unresolved.
Calculate combined profit factor from period totals
Suppose a hypothetical report has two non-overlapping periods. Period A has $900 in gains and $300 in losses, giving profit factor 3.00. Period B has $200 in gains and $400 in losses, giving a ratio of 0.50.
A simple average gives (3.00 + 0.50) ÷ 2 = 1.75. The combined ledger actually has $1,100 in gains and $700 in losses, so its profit factor is approximately 1.571.
The correct combined factor is a loss-total-weighted average of the period factors: (3.00 × $300 + 0.50 × $400) ÷ $700. This follows directly from the definition. A period with a larger loss denominator receives more weight.
Average winners and losers need their own counts. Suppose Period A has three winners totaling $900 and Period B has four winners totaling $200. The combined average winner is $1,100 ÷ 7, or approximately $157.14. Averaging the period averages of $300 and $50 would incorrectly give $175.
This same issue appears when combining symbols, accounts or strategy categories. Add the underlying comparable amounts and counts first. If observations overlap, remove double counting before calculating the combined statistic.
What “gross” means depends on the report
Gross profit often means the sum of winning trades rather than the profit after subtracting losing trades. It does not, by itself, establish which costs were deducted before trades were classified.
For a concrete platform distinction, MetaTrader 5’s trading-report documentation says its Gross Profit and Gross Loss fields exclude swaps and commissions, while some Profit and Loss fields include them. Mixing fields from those sections would create an inconsistent ratio.
Return to the first ledger and add a separate $10 cost per completed trade. Assume every gross winning trade exceeds $10, so each remains a winner after the charge. The average net winner is $140, and the average net loss magnitude is $85. Net winning amounts total $1,120; net losing amounts total $1,020. A ratio calculated from those net outcomes is approximately 1.098, and their net payoff ratio is approximately 1.647.
The net difference is $100, matching the original $300 less $200 in costs. Label these recomputed statistics as net-outcome ratios rather than claiming they are the platform’s unchanged Gross Profit fields.
If costs turn some small winners into losers, rebuild the groups from the resulting net ledger. Subtracting all costs from G while leaving D and the winner count unchanged will generally fail to reproduce those groups.
Execution-price effects also need a consistent basis. CrowdSent’s bid–ask spread explanation helps clarify why a reference quote and an executable price can differ. Never deduct a simulated spread again when that same price difference is already reflected in the recorded fills.
Inspect the denominator and the influence of large trades
A sample with $1,000 in gains and only $10 in losses has profit factor 100. That number describes the observed denominator. It does not show that a loss larger than $10 is impossible.
If there are no losing trades, D is zero and the ordinary ratio is undefined. A platform may show infinity, an empty field or a special value. Preserve that convention in exports; a missing ratio is not the same as zero.
There is another useful sensitivity check. A ledger with $1,500 in gains and $1,000 in losses has profit factor 1.50. If one winner contributes $700, the remaining trades have $800 in gains and $1,000 in losses, or 0.80. Report the original result and the sensitivity calculation separately.
The ordering of the trades is absent from both formulas. Rearranging identical outcomes leaves both ratios unchanged. Consequently, neither one reconstructs the account path or reveals when several losses occurred together.
A checklist for reconciling two trade reports
- Match dates, currency, instruments and closed-trade scope.
- Check how partial exits and reversals are grouped.
- Read the definitions of gross profit, gross loss and costs.
- Recalculate each group total and its observation count.
- Confirm that profit factor equals count ratio times payoff ratio.
- Combine subperiods from amounts and counts rather than headline ratios.
- Keep undefined values and missing observations visibly distinct.
Use the missing-data-versus-zero guide for that last distinction and a research journal to retain the report settings.
Frequently asked questions
1. Is profit factor a percentage return?
No. A factor of 1.50 means $1.50 of included winning amounts for each $1 of included losing amounts. It does not mean the account grew by 50%.
2. Does a payoff ratio above one imply a profitable sample?
No. Winners can be larger on average while occurring too infrequently to outweigh losses. The winner and loser counts are the missing information.
3. What does a profit factor of exactly one mean?
Included positive and negative amounts are equal. Whether the full account breaks even depends on omitted charges, open positions and any other items outside that ledger.
4. Can a payoff ratio be compared with a planned reward-to-risk ratio?
Only with clear labels. Payoff ratio here describes realized outcomes. A planned target divided by a planned loss allowance describes an intended setup rather than the completed result.
5. How do break-even trades affect the two ratios?
Exact-zero outcomes add neither gains nor losses and are in neither average subgroup. They do affect statistics using total trade count, such as the all-trades average outcome.
6. Why does average profit per trade differ from average winning trade?
Average profit per trade includes winners, losers and applicable zero outcomes. Average winning trade uses only the positive group. Their denominators answer different questions.
7. Can I average profit factors across symbols?
A simple arithmetic average generally differs from the combined factor. Sum comparable gross gains and loss magnitudes across non-overlapping symbols, then divide those totals.
8. Does doubling every position size change these ratios?
If every included outcome and cost scales exactly by two, both ratios stay unchanged. Fixed charges, changing fills or non-proportional costs can break that simplifying assumption.
9. What if there are losses but no winners?
With positive D and G equal to zero, profit factor is zero. Average winning trade and the usual payoff ratio are undefined because the winning group contains no observations.
10. Can either ratio establish future performance?
No. They summarize the selected ledger. Sample selection, execution assumptions and changing conditions remain important, and the ratios contain no guarantee about unseen outcomes.
To explore the workspace and its membership options, open CrowdSent.
Educational note: All examples are hypothetical. This article explains report calculations and does not recommend a trading strategy or promise returns.