

By CrowdSent Blog Team
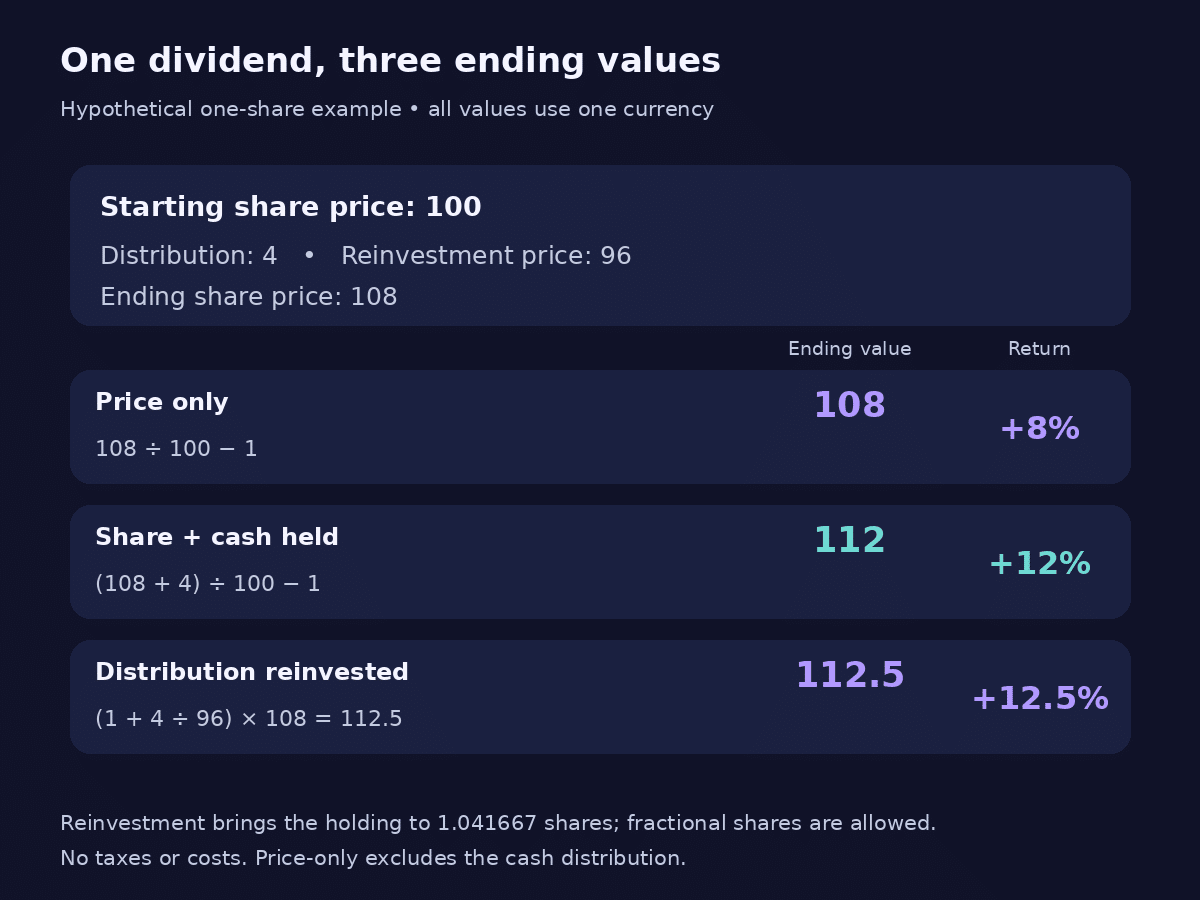
A hypothetical share starts at 100, distributes 4 and ends at 108. Its price gain is 8%. A holder who keeps the distribution as cash has a different result, while a total-return calculation with reinvestment can produce a third figure.
Price return vs total return is therefore a question about what the measurement includes. It is especially important when comparing Indian, Pakistani and international index charts: a familiar index name does not guarantee that each chart treats dividends the same way.
Price return vs total return: what is counted?
Price return measures the proportional change in a consistently defined price series. For one share with no intervening share-count changes, divide the ending price by the starting price and subtract one. Total return also accounts for distributions within the specified methodology.
The NSE Indices explanation of total return distinguishes constituent-price movements from dividend receipts and explains that indexed dividends are reinvested in its total-return calculation. That reinvestment rule matters when distributions occur before the end of the comparison period.
Start by naming the object: an individual share, a price index, a total-return index or a real account. These are different records. An index can embody a reinvestment assumption without showing the exact cash receipts, taxes and trading costs experienced by a particular holder.
For the examples below, all values are hypothetical and use one unspecified currency consistently. There are no transaction costs, taxes, external deposits, withdrawals or other corporate actions. Those simplifications keep the dividend treatment visible.
First calculate a return with the distribution held as cash
Begin with one fictional share worth 100. During the measurement period, it pays a distribution of 4 per share. At the end, the share is worth 108. Assume the distribution remains as non-interest-bearing cash.
The price return is (108 − 100) ÷ 100 = 8%. The ending combined value is 108 of shares plus 4 of cash, or 112. Relative to the original 100, the holding-period return including the cash distribution is 12%.
For this simple case, the formula is (ending price − starting price + distribution) ÷ starting price. It answers a clear question: how did the value of the original share plus retained distribution cash change?
Now alter only the ending price to 95. The price return becomes −5%, while share value plus cash ends at 99, giving −1%. Including a positive distribution does not guarantee a positive overall return. It changes what is counted.
A quoted dividend percentage needs its own denominator. Our distribution of 4 equals 4% of the starting market price of 100. A company announcement based on a different reference, such as face value, cannot be substituted without converting it to cash per share.
Then follow the reinvested distribution
Return to the original share starting at 100 and ending at 108. Now specify an intermediate observation: the share is priced at 96 when the hypothetical calculation reinvests the distribution of 4. Fractional shares are allowed in this classroom example.
The distribution buys 4 ÷ 96 = 0.0416667 additional shares. The total holding becomes approximately 1.0416667 shares. At the ending price of 108, their value is 1.0416667 × 108 = 112.5. The reinvested total return is 12.5%.
The same result can be built from two linked intervals. Across the distribution event, the value factor is (96 + 4) ÷ 100 = 1. Across the following interval, the factor is 108 ÷ 96 = 1.125. Multiplying gives 1.125, equivalent to a 12.5% return.
The extra 0.5 above the cash-held ending value of 112 comes from the additional fractional holding rising from its purchase price of 96 to 108. If its later price were lower, reinvestment could instead finish below the cash-held alternative. The example demonstrates an assumption, not a recommendation.
The chosen movement from 100 to 96 is constructed for transparent arithmetic. A real market price need not move by exactly the dividend amount, and an investor’s actual cash receipt and reinvestment timing need not match an index convention.
Check the Nifty and KSE-100 version explicitly
NSE Indices publishes a total-return methodology that includes dividend receipts, alongside price-index concepts. For a Nifty comparison, capture the full series label, including whether it is the price, total-return or net-total-return version. Avoid identifying the return basis from a shortened chart title alone.
Pakistan provides a particularly useful naming example. The PSX KSE-100 and KSE100PR methodology brochure identifies KSE-100 as a total-return index and KSE100PR as its price-return variant. The latter does not account for reinvestment of gross cash dividends.
Consequently, comparing a KSE-100 total-return history with a Nifty price-index history combines different dividend treatments. The arithmetic of each chart can be correct while the cross-market conclusion remains poorly specified. Align the return basis before discussing the size of the difference.
Currency is a separate requirement. An INR-denominated history and a PKR-denominated history measure changes in different units of account. If the research question requires a common currency, use a clearly documented conversion rather than treating the local-currency ranking as a universal result.
Gross, net and personal results have different boundaries
A total-return label still leaves open which deductions are included. In the S&P Dow Jones Indices mathematics methodology, net-total-return calculations adjust dividend amounts for specified withholding-tax assumptions before reinvestment. The relevant tax assumption belongs to the index definition.
That label does not automatically mean “after every cost and every tax for this reader.” A person’s country, account circumstances and actual transactions can differ from the model used by the provider. This article does not supply tax rates or personal tax guidance.
Fees also require explicit treatment. An index level and a fund’s reported value are different objects. One should not assume that brokerage, fund expenses, currency-conversion costs or individual cash timing are already incorporated simply because the word “total” appears.
Keep a short specification beside the return: price or total, gross or net under which assumptions, currency, dates and relevant costs. If a provider has not disclosed a field, mark it as unknown. A more complete-sounding name cannot fill in the missing methodology.
Avoid double-counting and misleading price adjustments
An adjusted price series may already incorporate some corporate actions. Before adding dividends to a downloaded adjusted series, read the provider’s definition. If its values already represent a dividend-adjusted return history, adding the same distributions again can count them twice.
Split adjustment is a separate issue from dividend inclusion. In a purely mechanical two-for-one split, one share priced at 200 becomes two priced at 100, leaving a total value of 200 before other movements. Comparing the raw per-share prices alone would suggest a 50% fall that the ownership-value calculation does not support.
The label “adjusted” is therefore incomplete without a list of adjustments. Record how the data treats cash distributions, share splits and other relevant events. Avoid combining an adjusted starting price with an unadjusted ending price.
Missing records can cause another false difference. A zero in the dividend field may mean no distribution, or it may be a placeholder for unavailable data. CrowdSent’s guide to missing market data versus zero explains why the distinction should remain visible instead of being silently resolved by the spreadsheet.
Build a comparison another reader can reproduce
Start with the exact identifier for each series and obtain its return definition from the original provider. Set the same starting and ending timestamps, then check the currency and distribution treatment. Rebase each compatible series to 100 only after those checks.
Rebasing changes the displayed starting level; it does not turn a price return into a total return. A line starting at 100 can still omit dividends, use a different currency or apply a different adjustment history.
The guide to base and quote currencies is useful when documenting a conversion. Preserve the exchange-rate quotation direction and the dates used. An incorrectly inverted rate can overwhelm the distinction you intended to study.
For our reinvestment example, an adequate record includes starting price 100, distribution 4, reinvestment price 96, final price 108, fractional shares allowed and costs excluded. Save those inputs in a market research journal. The resulting 12.5% is then a calculation someone can check, with its limits already attached.
Frequently asked questions
What is the main difference between price return and total return?
Price return tracks price changes. Total return also includes distributions according to a stated methodology, commonly assuming reinvestment in a total-return index. The dates, currency and deduction assumptions still need to be identified before comparison.
Is total return always positive when dividends are paid?
No. A positive distribution can coexist with a larger price decline. In the cash-held example, a starting price of 100, ending price of 95 and distribution of 4 produce an overall return of −1%.
Why does reinvestment change the answer?
A reinvested distribution changes the quantity held for the remaining period. In our example, 4 reinvested at 96 buys additional fractional shares that later increase in value. A different subsequent price path would change that reinvestment effect.
Can I add annual dividend yield to annual price return?
Only if the definitions and timing make that arithmetic appropriate. A beginning-value-based cash distribution can be added in the simple cash-held example. A published yield with another denominator or a reinvested multi-period index needs its own calculation.
Does the KSE-100 include dividends?
PSX identifies KSE-100 as a total-return index in its cited methodology. Its KSE100PR variant measures price return without reinvestment of gross cash dividends. Capture the exact variant from the data source rather than relying on a shortened name.
Is an adjusted closing price automatically a total-return series?
No universal assumption is safe. Providers can adjust for different events. Read the definition before calculating returns or adding distributions, and keep the adjustment convention consistent across both endpoints and the full history.
Does net total return equal my after-tax return?
Not necessarily. An index applies stated deduction assumptions, including specified withholding treatment where relevant. Your circumstances and costs may differ. The word “net” should prompt a methodology check rather than an assumption that every personal deduction is included.
Does reinvestment occur when I actually receive dividend cash?
An index follows its defined recognition and reinvestment timing, which may differ from an investor’s cash receipt and execution. The NSE methodology describes ex-date treatment. An actual account calculation needs the dates and amounts that apply to that account.
Can two series both start at 100 and still be incomparable?
Yes. Rebasing aligns their initial display value. It does not align currencies, dividend treatment, taxes, fees or observation windows. Those choices must be checked separately before interpreting which line finishes higher.
What should a return-chart caption include?
Name the exact instrument or index variant, currency, start and end dates, price or total-return basis, and any relevant net or gross assumptions. Add reinvestment and adjustment notes where needed so that another reader can find and reproduce the series.
Educational information only. All worked numbers are hypothetical unless identified as a source definition. This article provides no forecast, recommendation or investment advice.