

Implied volatility skew describes differences in implied volatility across option strikes for the same underlying and expiration. A single implied-volatility number can hide those differences. Reading the curve requires a consistent horizontal axis, synchronized quotations and a stated method of comparison.
This guide focuses on interpreting a cross-strike snapshot. Every number below is hypothetical. The examples do not describe a current market, forecast a crash or identify an option to buy or sell.
Read implied volatility skew across strikes for one expiration
Implied volatility is the volatility input that reconciles an option-pricing model with a selected market premium, given the other inputs. Plotting those inferred values across strikes creates a volatility curve. The curve’s shape can differ between products, as CME’s skew discussion explains.
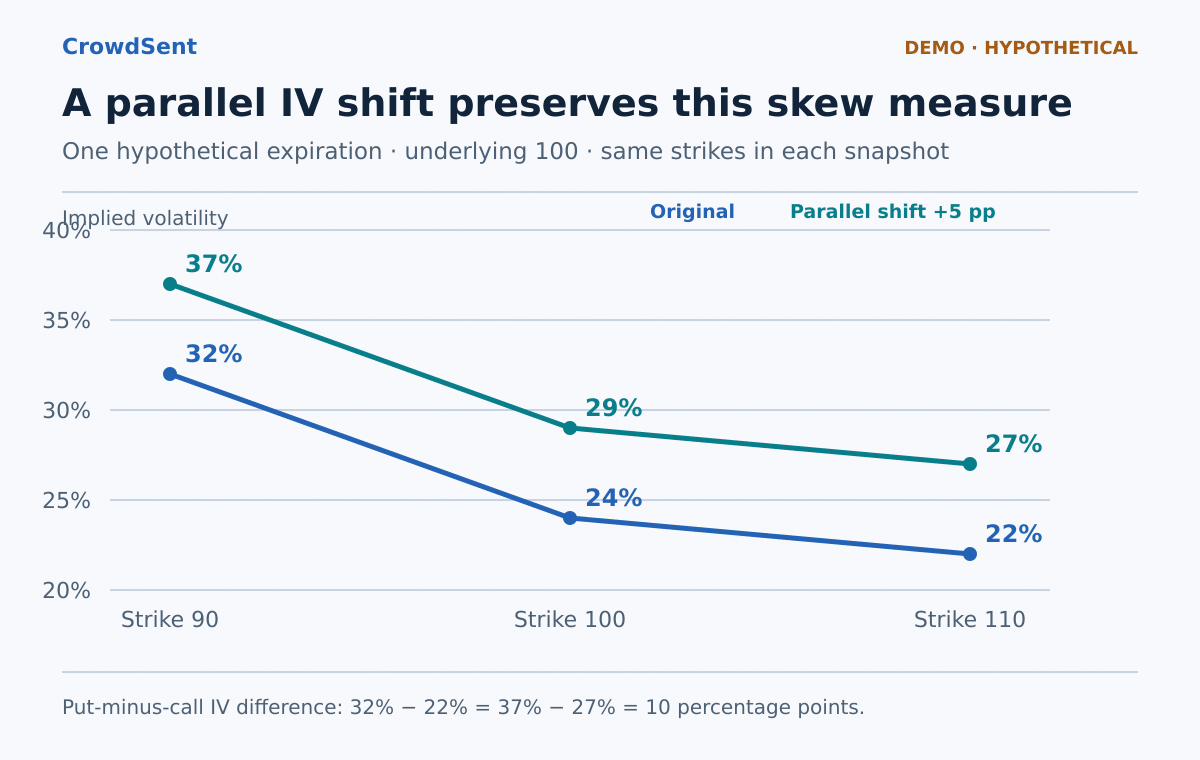
Start with an underlying at 100 and a single expiration 30 days away. Suppose a 90-strike put has 32% implied volatility, a near-the-money 100-strike option has 24%, and a 110-strike call has 22%. The observations describe higher implied volatility on the lower-strike side of this invented curve.
The 90-strike put is 10% below the stated spot price; the 110-strike call is 10% above it. Equal percentage distances from spot do not make their deltas equal in magnitude. A comparison based on equal absolute delta would be a different measurement.
Implied volatility skew: state the difference and its units
Using put implied volatility minus call implied volatility, the example’s wing difference is 32% minus 22%, or 10 percentage points. Relative to the 22% call figure, that difference is about 45.5%. Calling it simply “10% higher” confuses a percentage-point difference with a proportional change.
A second useful comparison is the 90-strike put minus the near-the-money reference: 32% minus 24%, or eight percentage points. These two measurements answer different questions. One compares the two wings; the other compares one wing with the center.
There is no single universal skew number. Some measures use selected strikes or deltas, while others summarize a wider set of options. CME’s CVOL methodology overview, for example, defines a skew measure using the difference between upside and downside variance components. That quantity should not be treated as the same units as this article’s simple IV difference.
Separate the volatility level from the curve’s shape
Now raise all three invented readings by five percentage points. They become 37%, 29% and 27%. The curve is higher, but the put-minus-call difference remains ten points and the put-minus-center difference remains eight. A level increase has occurred without a change in these particular slope measures.
In a different scenario, leave the center at 24% and call at 22%, but raise the put to 36%. The wing difference becomes fourteen points. This changes the selected skew measure while the near-the-money level remains unchanged.
These comparisons are arithmetic decompositions. They do not reveal which participants caused the repricing or what happens next. A claim that “volatility rose” should specify whether it refers to a particular strike, a central reference, a broader index or the entire curve.
Recognize different curve shapes
Equity-index options often display higher implied volatility for out-of-the-money puts than for comparably distant calls. Cboe’s discussion of volatility markets describes this commonly observed relationship. It is a market pattern rather than a requirement applying to every asset or date.
A curve with both wings above the center is often called a smile. A tilted curve is often described as a skew or smirk. CME’s convexity lesson explains the distinction. Use the actual measurements alongside these visual labels; a single word can hide an uneven or changing shape.
Comparing 30-day and 90-day options introduces another dimension: maturity. A term-structure comparison follows expirations rather than strikes. Combining strike and maturity produces a volatility surface, where a change in one slice need not describe the others.
Check the quotation before explaining the pattern
Suppose the 90-strike put implies 30% from its bid and 34% from its ask. A displayed 32% reference sits within that interval. If the 110-strike call has a much tighter IV interval, reporting the wing difference to several decimal places creates a misleading impression of precision.
Stale last trades, missing bids and inconsistent model inputs also affect inferred IV. Preserve the option premiums, underlying reference, timestamps, rates, dividend assumptions and model conventions. These are inputs to the comparison, not optional footnotes.
Prices can reflect risk compensation, demand for particular exposures and liquidity conditions. Skew alone cannot supply a dependable real-world probability of a specific event. Even a named index such as Cboe SKEW has its own methodology; it is not interchangeable with a two-strike subtraction.
Questions about implied volatility skew
1. Does a downward-sloping skew predict a falling stock?
No. It describes the relative implied volatility of selected contracts. Inferring direction or timing requires assumptions that the curve alone cannot establish.
2. Is a higher-IV option always more expensive in dollars?
No. Strike, time, intrinsic value and other inputs also affect premium. IV is a model-based comparison measure, not the quoted dollar price.
3. Must calls and puts at the same strike have different IV?
No. Under consistent European pricing assumptions, put-call parity links their values. Apparent differences can reflect quotes, exercise features or input inconsistencies.
4. Why hold expiration constant?
Otherwise the comparison mixes maturity effects with strike effects. Name the exact expiration and settlement convention for a cross-strike snapshot.
5. Can skew change while central IV stays flat?
Yes. In the worked example, the put rises from 32% to 36% while the center remains 24%, increasing the selected wing difference.
6. Can central IV rise without steeper skew?
Yes. A parallel five-point increase preserves the example’s ten-point wing difference. Other definitions of skew should still be checked separately.
7. Are 25-delta and 10% out-of-the-money comparisons equivalent?
No. Delta depends on the model and pricing inputs, while percentage moneyness uses a specified price reference. Name the method instead of interchanging labels.
8. What does a smile describe?
It usually describes higher implied volatility on both wings than around the center. The precise shape and relative heights can vary.
9. Should I compare skew numbers from different websites directly?
Only after matching definitions, units, expirations, timestamps and models. Opposite subtraction orders can even reverse the reported sign.
10. What makes a useful saved skew observation?
Keep the underlying, expiry, strike or delta convention, quote fields, model assumptions and subtraction formula. Mark any synthetic examples as demonstrations.
Educational note: This article is for education, not investment advice. Options involve risk, including loss of the premium and potentially larger losses for some written positions. Examples exclude fees, taxes and financing unless stated.
Explore CrowdSent membership.
For the quotation units behind these examples, read pips, lots and contract size. To compare a selected market quote, see bid and ask spreads.