

By CrowdSent Blog Team
On balance volume (OBV) is a running total of signed volume. When a bar closes above the previous close, its reported volume is added. When it closes below the previous close, that volume is subtracted. When the two closes are equal, the usual calculation leaves OBV unchanged.
The arithmetic is simple, but the label can encourage claims the data cannot support. OBV does not directly count buyers versus sellers, identify institutions or measure cash entering an asset. It assigns a direction to a whole bar’s volume using one close-to-close comparison. Understanding that assignment is the key to reading the resulting line.
The examples below are hypothetical and explain measurement choices. They are not investment recommendations.
How the on balance volume formula works
Let the previous OBV be the running total before the current bar. If current close is greater than previous close, new OBV = previous OBV + current volume. If current close is less, new OBV = previous OBV − current volume. If the closes match, new OBV = previous OBV.
MetaTrader’s OBV reference documents the three cases. The direction comes from the closing-price comparison; the magnitude of the update comes from the volume field.
Neither the size of the price change nor the path within the bar directly weights that volume. A close one small price increment above the previous close receives the same positive sign as a much larger increase. With equal reported volume, both bars add the same amount to OBV.
What “signed volume” means here
Suppose a bar contains 1,000 shares of reported volume and closes above the previous close. OBV adds 1,000. That is an indicator classification, not evidence that all 1,000 shares were purchased by one group, that sellers were absent or that every transaction moved the price upward.
The calculation does not inspect individual trade initiators or participant identities. It only receives the closing comparison and the bar’s volume. A conclusion about who traded would require data that those inputs do not contain.
A five-step hypothetical OBV calculation
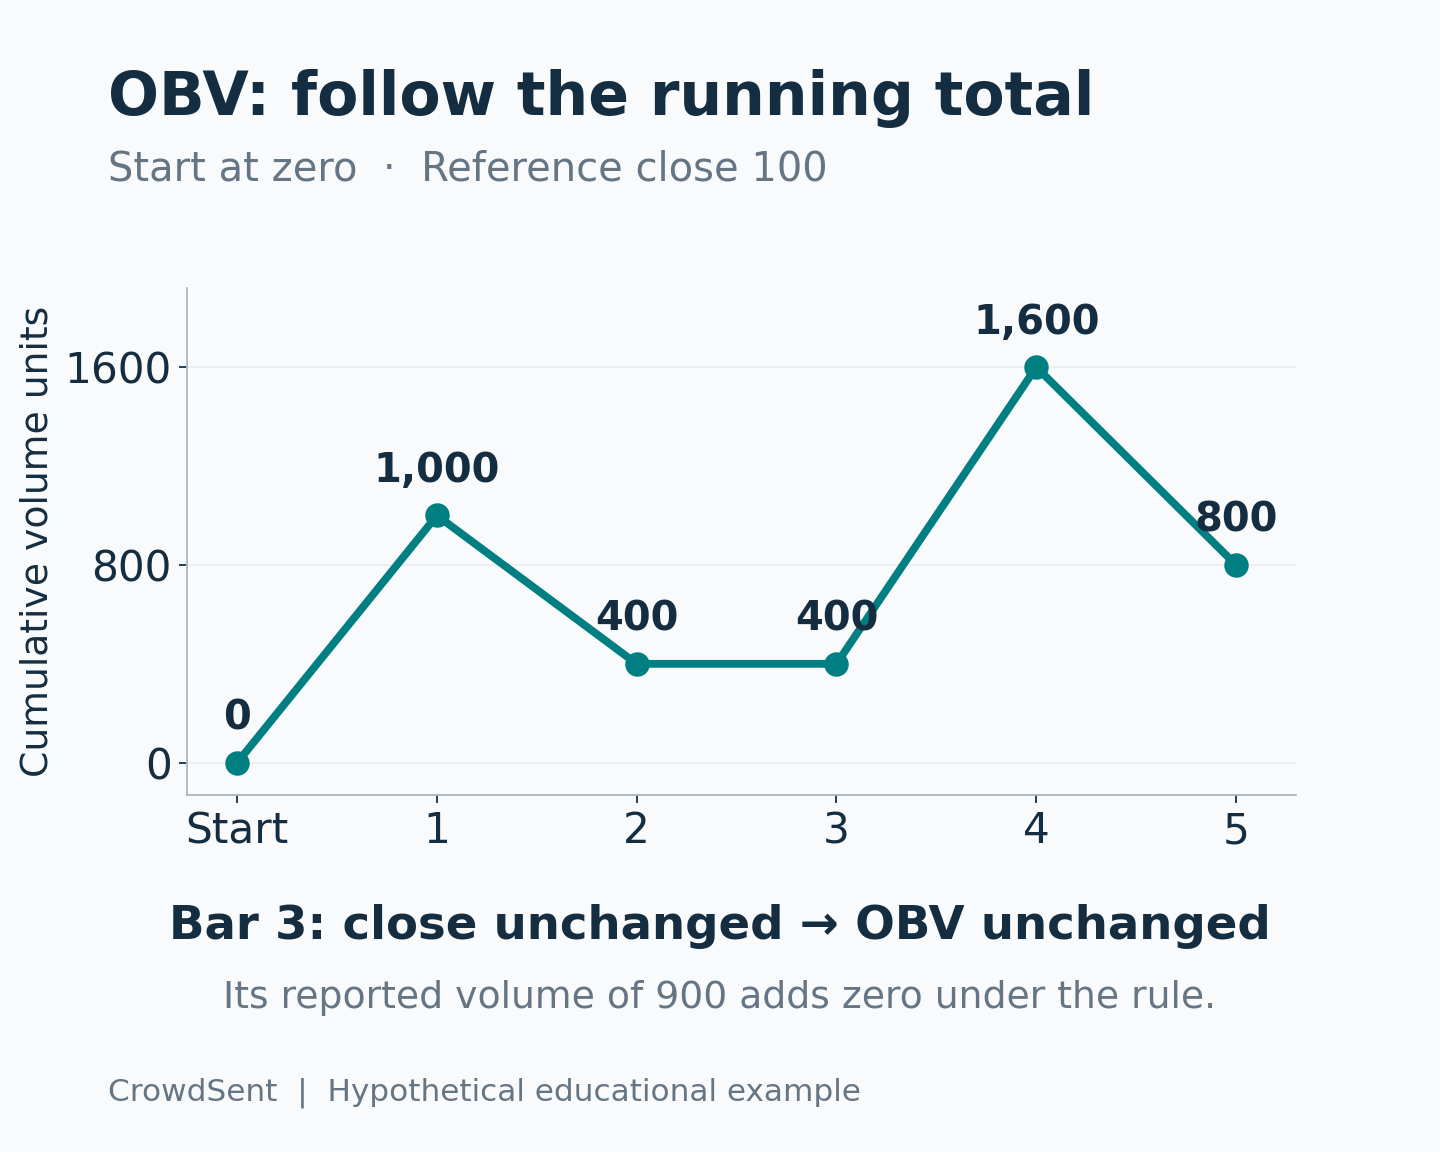
Start with a reference close of 100 and an OBV baseline of zero. This reference is a starting state, not an additional volume observation. Then process the following five completed bars in order.
- Bar 1 closes at 102 with volume 1,000. The close rose, so OBV becomes 0 + 1,000 = 1,000.
- Bar 2 closes at 101 with volume 600. The close fell, so OBV becomes 1,000 − 600 = 400.
- Bar 3 closes at 101 with volume 900. The close is unchanged, so OBV stays at 400.
- Bar 4 closes at 103 with volume 1,200. The close rose, so OBV becomes 400 + 1,200 = 1,600.
- Bar 5 closes at 102 with volume 800. The close fell, so OBV becomes 1,600 − 800 = 800.
Total reported volume across the five bars is 4,500. OBV’s net change is only 800 because positive and negative assignments offset, and the 900 on the unchanged-close bar contributes zero. Neither quantity replaces the other: total volume describes activity, while the OBV change describes this particular signed accumulation.
The closing price ended two units above the initial reference. That two-unit change and the 800-unit OBV change have different units and constructions. Dividing one by the other without a defined analytical purpose would not produce a standard OBV interpretation.
The starting value changes the level
Repeat the same updates from an arbitrary baseline of 10,000. The sequence becomes 11,000, 10,400, 10,400, 11,600 and 10,800. Every reading is exactly 10,000 above the earlier version. The bar-to-bar changes and the shape are unchanged.
This is why a standalone OBV level is difficult to compare across charts. The starting date and initial value are part of its definition. TC2000’s OBV documentation specifically notes the arbitrary nature of the indicator’s numerical value and the importance of relative movements.
A negative level is therefore possible without negative trading volume. Starting from zero, a sequence with more subtracted than added volume will produce a negative cumulative total. Its sign depends partly on the baseline and does not independently identify whether the asset is attractive.
Trace one volume correction through the later totals
Return to the five-bar example and suppose the provider corrects Bar 2 volume from 600 to 650. Its close still falls from 102 to 101, so the revised signed update is −650. Bar 1 remains at 1,000, while Bar 2 becomes 1,000 − 650 = 350.
Bar 3 still has an unchanged close and leaves OBV at 350. Bar 4 adds 1,200 to reach 1,550, and Bar 5 subtracts 800 to reach 750. Every cumulative value from Bar 2 onward is now 50 below the original sequence. Later individual updates have not changed.
This creates a useful diagnostic pattern: agreement before a particular bar, followed by a constant offset afterward, can point to a revised historical increment. It does not prove that explanation without checking the source. Preserve the original and corrected volume observations, and distinguish a data correction from a different baseline that would offset the entire shared history.
Which volume does the indicator use?
The input deserves as much attention as the formula. An equity series may report shares; a futures series may report contracts; another feed may provide tick volume. These are different measurement units. Do not compare their raw totals as though each one counted the same economic quantity.
MetaQuotes’ iOBV documentation exposes an applied-volume parameter. Its volume-type definitions distinguish tick volume and trade volume. A selectable field does not establish that every symbol has reliable values for every volume type.
Ask what the feed actually covers: which venue, which session, which instrument and which transactions? A single-venue total and a consolidated total can differ even if both are accurately reported. If the source changes halfway through the series, the apparent shift in OBV may partly reflect a coverage change.
OBV is not a direct money-flow statement
In the worked example, volume was labeled only in units. If those units are shares, adding 1,000 means adding 1,000 shares under the indicator rule. It does not mean 1,000 currency units flowed into a company. The formula does not multiply each trade’s size by its transaction price.
Even a dataset whose volume field is denominated in a quote currency would require that definition to be stated. Calling an accumulated signed field “net inflows” would still add a claim about economic flows that a close-based sign assignment does not establish.
Liquidity is a separate question too. High reported activity does not by itself show available depth at the price and size a reader cares about. CrowdSent’s guide to liquidity versus volume explains why those concepts need separate evidence.
Why daily OBV differs from summed intraday OBV
Aggregation changes which closing comparisons assign the signs. Consider a hypothetical day beginning from a previous daily close of 100. Its first intraday bar closes at 101 on volume 100. Its second closes at 100.5 on volume 900.
Using these two intraday bars, the first update is +100 and the second is −900, giving a net OBV change of −800. But the complete day’s close of 100.5 is above the previous day’s 100. If the daily bar contains the full volume of 1,000, daily OBV adds +1,000.
The two answers are not an arithmetic contradiction. The intraday calculation classified two separate closing changes; the daily calculation classified one closing change and assigned its sign to the combined volume. Summing intraday OBV changes therefore need not reproduce a daily OBV update.
This example also explains why chart timeframes are substantive inputs. Switching from hourly to daily bars changes the indicator’s classification process, rather than merely making the same line look smoother.
Read differences as questions, not explanations
Suppose a price series makes a higher selected peak while OBV does not exceed its earlier selected peak. The observable statement is that price and signed-volume accumulation did not make corresponding highs over those comparison points. It does not identify the cause or guarantee what comes next.
A useful investigation checks the bar selection, volume coverage, large one-off observations and the baseline. It also checks whether the data were revised. A single large signed volume bar can shift the cumulative level for all later observations, even though later bar-to-bar updates return to their previous scale.
If an interpretation invokes investor mood, distinguish the price-volume calculation from evidence about what people said or believed. CrowdSent’s discussion of social media and broker order flow is useful context for keeping different datasets and populations separate.
Audit the increments before the cumulative line
When two platforms disagree, calculate each bar’s OBV change first. If the increments match but the levels differ by a constant, initialization is a likely explanation. If increments differ, check close comparisons, volume fields, timeframe and missing-bar handling.
Do not fill unavailable volume with zero simply to obtain a continuous line. A flat step created that way can be mistaken for genuinely absent activity. Use the checks in missing market data versus zero and keep unresolved observations labeled as unavailable.
Frequently asked questions about on balance volume
1. Does OBV count buyers minus sellers?
No. It assigns a sign to a bar’s entire volume using the current close versus the previous close. It does not count participant identities or subtract seller counts from buyer counts. Those would require different source data and a different methodology.
2. Why is my OBV number negative?
A negative value can arise when cumulative subtractions exceed additions relative to the chosen starting value. Volume itself need not be negative. Check the baseline and recent increments before assigning meaning to the sign of the cumulative level.
3. What happens when two consecutive closes are equal?
In the usual three-case formula, OBV is unchanged even if that bar reported substantial volume. The example’s 900-volume unchanged-close bar contributes zero. This is a rule of the indicator, not a claim that no transactions occurred.
4. Does a larger price increase add more OBV?
Not by itself. The magnitude of the standard update is the reported volume, while the closing comparison supplies only the sign. A small increase and a large increase with identical volume create identical positive updates.
5. Can two charts have different OBV levels but the same shape?
Yes. Different initial values can produce a constant vertical offset with matching subsequent increments. Compare changes over the same bars before concluding that one calculation is wrong. Different history lengths can also establish different cumulative starting states.
6. Is tick-volume OBV equivalent to trade-volume OBV?
No. The same arithmetic applied to different volume definitions produces measures with different inputs and units. Record the selected volume type and the feed’s coverage. A tick count should not be relabeled as the quantity of shares or contracts traded.
7. Can I add hourly OBV changes to reproduce daily OBV?
Not generally. Hourly signs depend on hourly closing changes, while the daily sign depends on one daily closing comparison. The worked aggregation example produces −800 intraday and +1,000 daily from the same total activity.
8. Does OBV divergence prove institutions are buying?
No. Participant identity is absent from the basic close-and-volume inputs. A divergence can motivate a closer look at the data, but attributing it to institutions requires independent evidence about who traded and cannot be inferred from the line alone.
9. What can a historical volume correction change?
Correcting a signed volume observation changes that bar’s increment and every later cumulative level, unless another adjustment offsets it. Preserve source versions when comparing old screenshots with new exports. A changed level may reflect revised data rather than new trading.
10. What should I record with an OBV observation?
Include instrument, venue or coverage, volume units, bar duration, session, price adjustment policy, baseline, start date and observation timestamp. Identify whether the last bar is complete. These details make the calculation reproducible and reveal which comparisons would be misleading.
Conclusion: check the sign rule and the volume source
On balance volume is a compact record of volume classified by close-to-close direction. Its strengths and limitations follow from those inputs. Verify the running increments, the baseline, the volume definition and the bar interval before interpreting the shape. That keeps a clear arithmetic observation separate from claims about participants, liquidity or future returns.
Source documentation checked 11 October 2026. Educational explanation from the CrowdSent Blog Team. Numerical examples are hypothetical unless explicitly identified otherwise. This article does not provide investment recommendations.