

Maximum drawdown is the largest observed percentage decline from a prior peak to a later trough within a specified series and period. It describes one aspect of the path taken by that series. A start-to-finish return can look positive while the intervening path contains a substantial drawdown.
To read the number properly, ask which values were measured, when the observation window began and how frequently observations were recorded. This guide works through an invented value series, shows the recovery arithmetic and explains the information that one maximum-drawdown percentage leaves out. It is a measurement guide, not a recommendation about an investment or acceptable level of loss.
Maximum drawdown starts with a running peak
At each observation, find the highest value recorded up to that point under the chosen measurement rules. That is the running peak. Compare the current value with that peak. When the value reaches a new high, update the running peak and the current drawdown returns to zero.
The MSCI IndexMetrics methodology describes maximum drawdown as the largest peak-to-trough decline over the analysis period. This definition requires the peak to come before the trough. Subtracting the lowest and highest values anywhere in an unordered list can produce a different and misleading result.
For a positive value series, the drawdown magnitude is: (running peak − current value) ÷ running peak × 100. Take the largest such percentage over the selected period. Some reports show drawdowns as negative numbers instead; a 25% magnitude and −25% signed drawdown can describe the same decline.
Keep the sign convention visible. A request for the “maximum” of a list of negative drawdowns could accidentally return the value nearest zero if the calculation ignores the intended meaning. In this article, maximum drawdown is presented as a positive loss magnitude.
Work through one complete hypothetical path
Consider seven observations of a fictional total-value index: 100, 120, 108, 90, 105, 125, 110. These numbers are invented to demonstrate the calculation. Assume the series is consistently measured, values are positive and there are no external cash flows.
At 100, the running peak is 100 and drawdown is zero. At 120, a new peak is established. The following value of 108 is 12 below 120, giving a 10% drawdown. The next value, 90, is 30 below 120, giving 30 ÷ 120 = 25%.
The rebound to 105 reduces the current drawdown to 12.5%, because the reference peak remains 120. It does not erase the previously observed 25% maximum. The next observation, 125, exceeds the old peak and establishes a new one. The final value of 110 is 15 below 125, or 12%.
The maximum drawdown across this path is therefore 25%, from 120 to 90. The latest drawdown is 12%, from the later peak of 125 to 110. The start-to-finish change is +10%, from 100 to 110. These are three distinct measurements, and all can be reported together without contradiction.
Notice why ordering matters. The lowest value is 90 and the highest is 125, but 125 comes after 90. Calculating a decline from 125 to 90 would invent a sequence that did not happen in this sample.
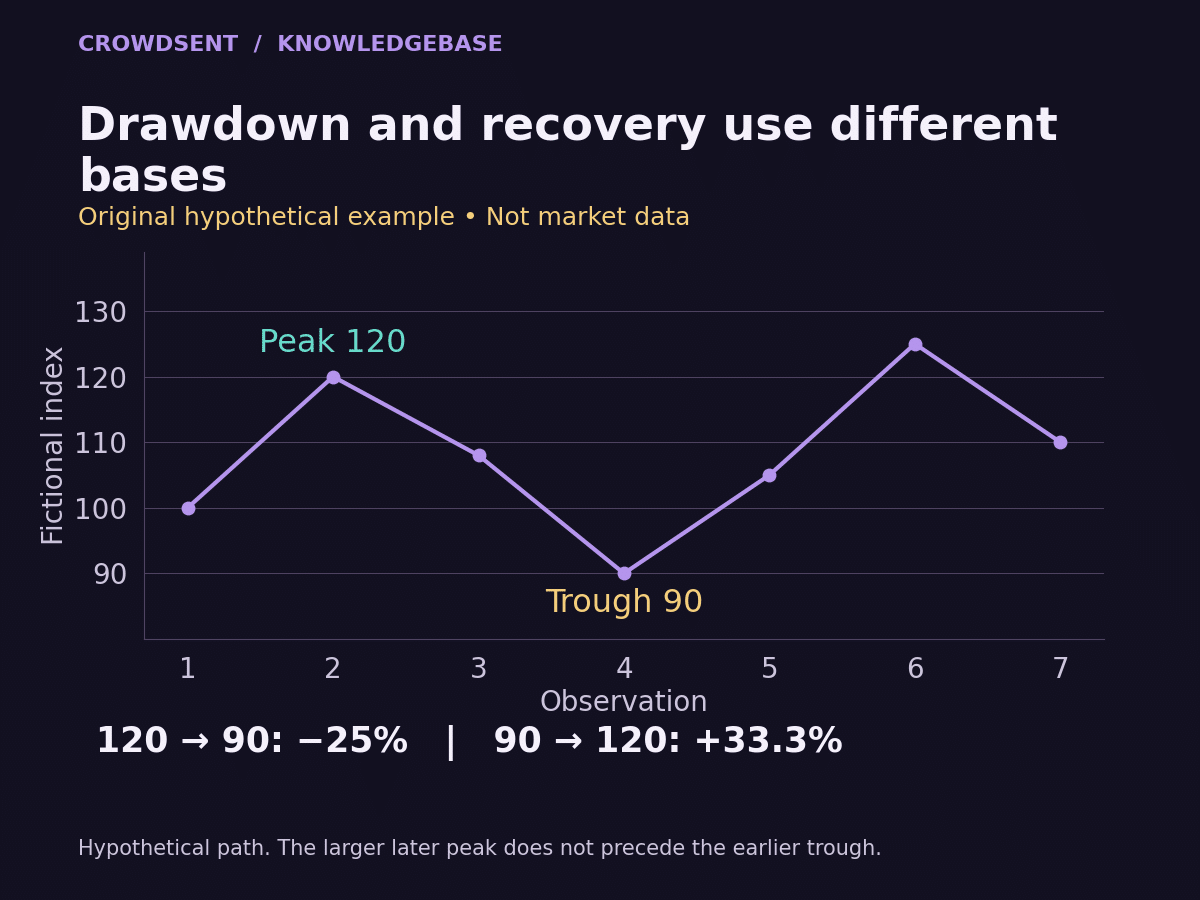
A 25% decline needs a 33.3% gain to recover
The decline and the recovery use different denominators. Falling from 120 to 90 loses 30 out of 120, or 25%. Returning from 90 to 120 gains 30 out of 90, or approximately 33.3%. The amount restored is the same, but it is measured against a smaller starting value.
If the drawdown is expressed as a decimal d, the proportional gain needed to return to the old peak is d ÷ (1 − d), for a positive remaining value. A 10% decline requires about 11.1% recovery; a 20% decline requires 25%; a 50% decline requires 100%. These are arithmetic identities, not assumptions that a recovery will occur.
In our example, adding 25% to the trough of 90 produces 112.5, which remains below the old peak of 120. This is why a report that pairs a percentage loss with an equal percentage rebound needs checking. Equal-looking percentages can describe unequal amounts.
The recovery calculation also needs a consistent series. Reaching an old unadjusted price after a distribution is a different comparison from restoring a total-return value. Choose the value definition first, then apply the arithmetic without switching definitions halfway through.
Depth and time below a peak answer different questions
A 25% maximum tells you the deepest measured decline. It does not tell you how quickly the trough arrived or how long the value remained below its previous peak. Two fictional series can both fall from 120 to 90 while taking very different amounts of time to return to 120.
The MSCI discussion of historical market downturns distinguishes maximum decline, time to bottom and time to recovery. Those are useful separate fields for a research record. Its historical findings should not be treated as a timetable for a different market or a future event.
Write the peak date and trough date alongside the depth. If recovery is observed, record the first observation that meets the stated recovery rule, usually a return to or above the old peak. Specify whether duration uses calendar days, trading sessions or another unit.
If the dataset ends while the value remains below that peak, record recovery as “not observed by the sample end.” You still have a measurable drawdown. You do not have a completed recovery duration, and filling in an expected date would add an unsupported assumption.
The observation window changes the available history
Now start a new analysis at the third observation in our fictional path, 108. If the running peak is initialised within that new window, the following trough of 90 produces a 16.67% decline. The earlier peak of 120 is absent, so this window does not capture the original 25% drawdown.
Some analyses carry an earlier high-water mark into a reporting window; others initialise the peak at the window’s first value. These approaches answer different questions. State whether you are measuring declines wholly observed inside the period or current depth relative to an earlier peak.
A since-inception figure and a one-year figure also cover different histories. A short sample may omit a severe episode that a longer sample includes. If the data, definition and peak convention are held consistent, comparing the dates helps explain why the headline values differ.
Keep sample start, sample end and source version in the report. Historical series can be revised or corrected. The guide to reading historical data in context offers related checks for windows, gaps and changing coverage.
Intraday and end-of-day drawdowns can differ
Imagine a series whose previous daily close and running peak are 120. During the next day, it falls to 90, then closes at 118. A calculation using only those two daily closes records a drawdown of about 1.67%. A sufficiently detailed intraday series that includes the fall to 90 records 25%.
Neither calculation should be labelled without its observation frequency. End-of-day data measures drawdowns in end-of-day values. It does not capture every intraday extreme. Sparse or missing observations can also hide a trough, so check completeness before comparing a finely sampled series with a coarser one.
An OHLC bar can identify a high and low without telling you their within-bar order. If both would be needed to establish an intraday peak followed by a trough, the bar alone may leave the sequence unresolved. Avoid assuming that every bar’s high occurred before its low.
A missing observation should not be replaced casually with zero or with a convenient value that smooths the path. Such a substitution changes the drawdown calculation. Missing market data versus zero explains the distinction and why the gap itself belongs in the record.
Define the value series before comparing the number
A raw account balance can fall because money was withdrawn. It can rise because money was deposited. Those changes do not necessarily represent investment performance. A performance drawdown therefore needs an appropriately cash-flow-adjusted series and a stated methodology, rather than treating every balance movement as a return.
Also specify whether the series includes distributions, fees and currency conversion. An index calculation, a simulated account and an actual account may treat those items differently. A comparison is meaningful only when the differences are understood and relevant to the question.
For a multi-asset portfolio, calculate the portfolio value path under its actual weighting and rebalancing rules. Averaging the components’ separate maximum drawdowns will generally miss timing: one component’s trough may occur while another is recovering. The joint path is the object being measured.
This percentage method assumes a suitable positive value base. A raw instrument price that can reach zero or become negative needs special care; the ordinary percentage interpretation may break down. Do not silently apply a familiar formula to a series for which its denominator and economic meaning no longer fit.
Frequently asked questions
How do you calculate maximum drawdown?
Track the highest value observed so far, calculate each later value’s percentage shortfall from that running peak and keep the largest shortfall. Preserve time order and state the observation period, frequency and sign convention.
Is maximum drawdown the same as the total return?
No. Total return compares defined starting and ending values. Maximum drawdown examines an intervening peak-to-trough path. Our fictional series finishes 10% higher while containing a maximum drawdown of 25%.
Can the lowest point come before the highest point?
It can in the dataset, but you cannot pair that earlier low with a later high to describe a decline from that high. A valid drawdown requires the reference peak to occur before the measured trough.
Does a recovery erase the historical maximum drawdown?
No. Recovery reduces the current drawdown to zero when the relevant peak is regained. The worst decline remains part of the historical maximum for any observation window that still includes that episode.
Why does a 25% drawdown require a 33.3% recovery?
The loss is measured against the larger peak and the gain against the smaller trough. Falling from 120 to 90 loses 25%; gaining the same 30 from 90 requires approximately 33.3%.
Can I report maximum drawdown before recovery happens?
Yes. You can measure the largest decline observed so far. State the sample end and mark the recovery as unobserved if the old peak has not been regained. The drawdown may deepen with later observations.
Can maximum drawdown be zero?
Yes, for a consistently measured positive series that never falls below its running peak at the sampled observations. That result describes the observed sample and frequency; it does not establish that loss is impossible.
Why do two reports show different drawdowns?
Check dates, observation frequency, adjustments, currency, fees, cash flows and peak initialisation. A signed negative value may also be the same decline that another report presents as a positive magnitude.
Is a past maximum drawdown a limit on future loss?
No. It is the deepest decline found in the specified historical observations. Later conditions or a longer sample can produce a deeper decline. The word “maximum” applies to the measured sample, not every possible future outcome.
Does a smaller maximum drawdown make a series better?
The number alone cannot answer that. Comparisons need consistent measurement and broader context, including duration, coverage and the nature of the series. This guide explains the statistic without recommending a product, strategy or acceptable loss.
For a reusable research note, record the value definition, sample dates, frequency, running-peak rule, maximum depth, peak and trough dates, and observed recovery status. The market research journal guide provides a place to keep that method and any later corrections together.