

By CrowdSent Blog Team
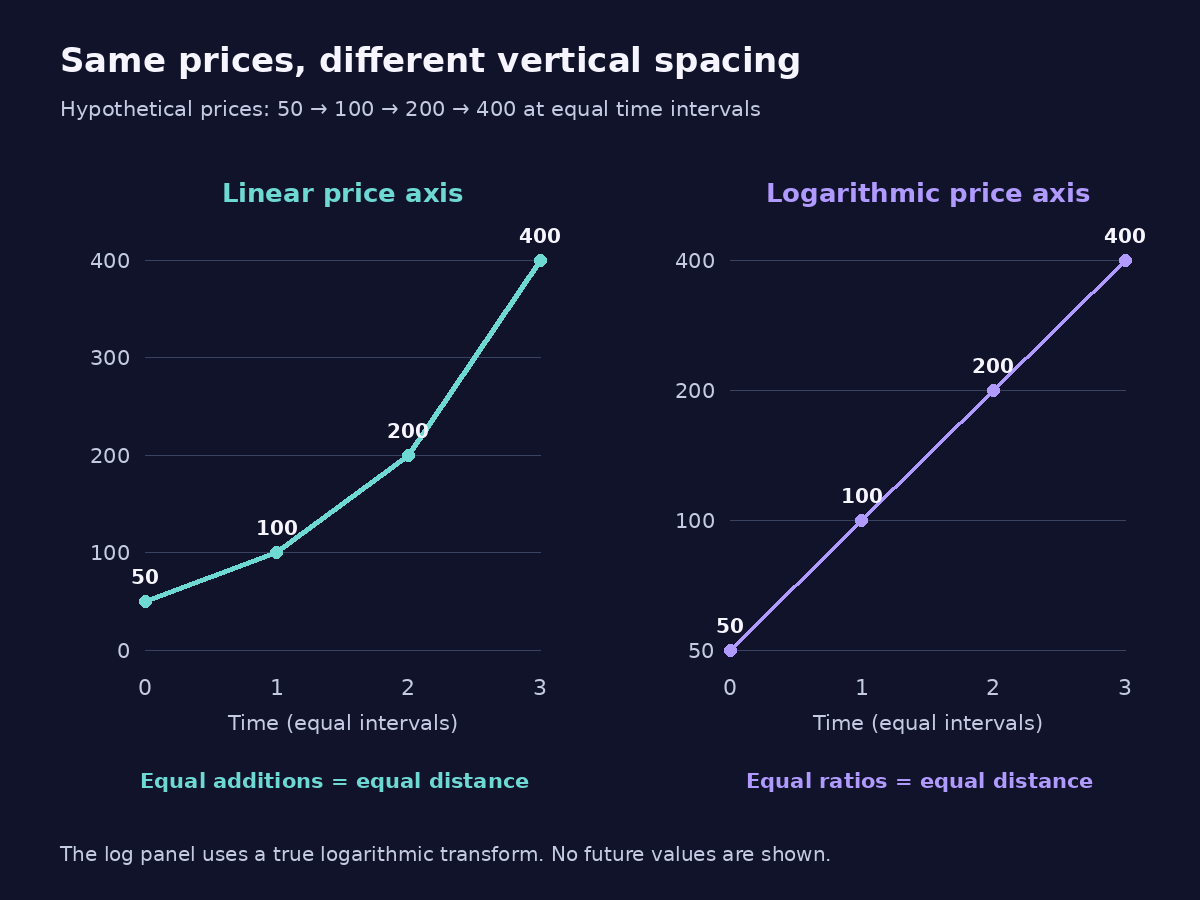
A hypothetical price doubles from 50 to 100, then to 200 and then to 400 at equally spaced times. A linear chart makes each successive rise look taller. A logarithmic chart gives the three doublings equal vertical distance. Both can display the same four observations correctly.
Reading a linear vs logarithmic chart starts with its axis, before interpreting the shape of the line. This guide explains what the two scales preserve, how to check their geometry and why a change in visual appearance does not add new market evidence.
Linear vs logarithmic chart: the equal-distance rule
A linear vertical axis assigns equal distance to equal absolute changes. With ticks at 0, 100, 200, 300 and 400, each step represents another 100 price units. Moving from 100 to 200 covers the same vertical distance as moving from 300 to 400.
A standard logarithmic vertical axis assigns equal distance to equal ratios. Ticks at 50, 100, 200 and 400 can be equally spaced because each value is twice the preceding one. The absolute gaps grow while the proportional changes remain equal.
The Open University explanation of logarithmic scales distinguishes additive steps on a linear scale from multiplicative steps on a logarithmic one. That distinction is the foundation of the chart-reading method.
In a price-over-time chart, the time axis often stays linear while only the price axis is logarithmic. This arrangement is commonly called a semi-log chart. Always check both axes: a logarithmic time axis would introduce a separate transformation.
Draw the same observations on both scales
Our invented observations are 50 at Time 0, 100 at Time 1, 200 at Time 2 and 400 at Time 3. The time gaps are equal, and all prices use the same unspecified currency. There are no missing points or changes to the underlying data between the two panels.
On a linear price axis, the rises are 50, 100 and 200 units. Their vertical lengths are in the ratio 1:2:4. Joining the observations produces a line that steepens because the absolute increments grow.
On a logarithmic price axis, each rise multiplies price by two. The log differences are ln(100 ÷ 50), ln(200 ÷ 100) and ln(400 ÷ 200). Every one equals ln(2), approximately 0.693147. Each step therefore has the same vertical length.
The three observations after the start lie on a straight line when joined on that semi-log chart. This shows a constant proportional rate in the constructed sample. It says nothing about whether the next point will double again.
Reading only the linear panel might invite the phrase “growth accelerated.” Qualify that statement: the absolute increments increased, while the percentage change stayed at 100% each interval. The chart choice determines which part of the same arithmetic is visually prominent.
Choose the scale for the question you are answering
A linear scale is useful when the question concerns absolute differences in the plotted unit. If you are checking whether an observed movement is 10 or 20 price units, equal absolute spacing makes that comparison direct.
A logarithmic scale is useful when the question concerns ratios or proportional changes across widely separated levels. A doubling early in a long history receives the same vertical emphasis as a doubling later, even if the later currency-unit increase is much larger.
The CDC guide to arithmetic and semi-log graphs explains how log axes help display wide ranges and compare relative rates of change. Its charting principles apply to the geometry here; the market examples in this article are independently constructed.
Neither choice is automatically the honest or dishonest one. A useful caption states the scale and the question. Sometimes a paired display is clearest because it shows absolute and proportional movement together without asking one chart to do both jobs.
Keep the sample window fixed when switching scales. Otherwise a changed start date or newly included observation may alter the picture at the same time, making it hard to tell which difference came from the axis.
Check a midpoint instead of guessing from the picture
Suppose the bottom and top of a selected vertical range are 100 and 400. On a linear axis, the halfway value is the arithmetic midpoint: (100 + 400) ÷ 2 = 250. Each half spans 150 price units.
On a logarithmic axis, the halfway value is the geometric midpoint: the square root of 100 × 400, which is 200. The lower half multiplies 100 by two; the upper half multiplies 200 by two. The distances are equal because their ratios match.
This is a useful check when a screenshot lacks a scale label. Inspect neighbouring tick values and their spacing. Equal additions suggest a linear scale. Equal multiplication factors at equal distances suggest a logarithmic one. If the ticks are unclear or incomplete, do not infer the scale from line shape alone.
A percentage increase and its reversal have equal log-distance magnitudes when they undo the same ratio. From 100 to 200 is +100%; from 200 back to 100 is −50%. They traverse the same two axis positions in opposite directions, despite different ordinary percentage magnitudes.
Separate mathematical slope from screen appearance
A straight rising line on a linear price-versus-time chart represents a constant absolute increment per unit of time. A straight rising line on a semi-log chart represents a constant proportional growth factor over equal time steps. The two statements describe different patterns.
For example, the sequence 50, 100, 150, 200 increases by 50 each interval. It is straight on a linear chart. Its percentage changes are 100%, 50% and approximately 33.33%, so its slope becomes less steep on a logarithmic chart.
The screen angle also depends on the chart’s width, height and visible range. Stretching the same plot vertically makes its line look steeper without changing any observation. Avoid comparing angles from two screenshots with different aspect ratios as though they were directly measured growth rates.
A straight line connecting two points also has a scale-dependent midpoint. Between prices 100 and 400 at equally separated endpoints, a straight linear-scale interpolation passes through 250 halfway in time; a straight log-scale interpolation passes through 200. Neither interpolated point is an observed trade unless the underlying data records it.
Know what logarithmic scaling cannot display
A standard real logarithmic price axis requires strictly positive values. Zero has no finite logarithm, and negative values do not fit this ordinary real-valued transformation. If a series includes either, inspect how the software handles them rather than assuming the displayed result uses the simple log rule.
Some tools implement modified scales or special handling around zero. Such behaviour must be checked in that tool’s documentation. Quietly deleting a nonpositive observation or replacing it with a tiny positive value would change the evidence.
The logarithm’s base affects the numerical transformed units, but not the equal-ratio principle. The NIST logarithm definitions and change-of-base relationship show why changing between ordinary bases such as 10 and e rescales the transformation by a constant factor.
Most price charts still label their log axis with original prices, such as 100 or 200. The labels are not necessarily the logarithms themselves. Likewise, a chart labelled “percent” may show linear percentage changes from a reference value; that is not enough to establish a logarithmic price axis.
Check a linear vs logarithmic chart before interpreting its curve
First identify the exact instrument, source, currency and observation period. A differently defined series can change the line before any scale setting is considered. The guide to BTC/USD versus BTC/USDT gives one example of why similar-looking market labels need checking.
Next, preserve the axis type, limits, tick labels and timestamp convention. Record whether the chart uses raw or adjusted values. Scaling does not add omitted dividends, correct a split or reveal an unobserved price between displayed points.
If a line connects observations across a gap, do not treat the connection as evidence of an uninterrupted path. CrowdSent’s explanation of missing market data versus zero helps distinguish absent observations from actual unchanged or zero values.
Finally, write the observation in numbers. “The price doubled in each of three equal intervals” is reproducible from our example. “The curve looks ready to break higher” is a separate forecast without support from the axis transformation. Keep the original screenshot and its labels in a market research journal alongside the numerical statement.
Linear vs logarithmic chart: frequently asked questions
What is the main difference between linear and logarithmic charts?
Equal vertical distance means equal absolute change on a linear price axis and equal proportional change on a logarithmic price axis. The same underlying data can therefore have a different visual shape without either version changing the recorded observations.
Why does a doubling look the same at different prices on a log chart?
Each doubling has the same ratio of ending price to starting price: two. Its log difference is therefore ln(2), regardless of whether the move is from 50 to 100 or from 200 to 400.
Does switching to a log scale change my returns?
Changing only the display scale does not change the underlying endpoint values or their calculated simple return. Check that no other setting, such as currency, adjustment basis or sample dates, changed at the same time.
Is a logarithmic chart better for every long history?
A long history with a wide range of positive values can benefit from a proportional view. The best display still depends on the question. Show a linear view when absolute differences matter, and label the choice so the reader understands the geometry.
Can a standard log-price chart show zero or negative prices?
No. The standard real logarithmic axis described here requires positive inputs. A platform displaying nonpositive values may use a modified transformation or special handling. Check its methodology and do not silently discard those observations.
Is halfway between 100 and 400 always 250?
Only on a linear scale. The halfway position on a logarithmic scale is 200 because the ratio from 100 to 200 equals the ratio from 200 to 400. The midpoint depends on what equal distance represents.
Why does a straight log-chart line suggest constant percentage growth?
With equal time spacing, a constant change in logarithm corresponds to a constant multiplicative factor in the original values. That describes the plotted sample; extending the same line into future time adds an assumption rather than new evidence.
Is a percentage chart the same as a logarithmic chart?
Not necessarily. A percentage chart can plot ordinary changes relative to one reference on a linear axis. Inspect the actual scale definition. A label containing a percentage sign does not by itself prove equal-ratio spacing.
Can I compare trendline angles across screenshots?
Not reliably without identical axes, ranges and aspect ratios. A taller panel or narrower time window can change the screen angle. Use the underlying prices and elapsed times to describe a rate of change instead of relying on visual steepness.
Does rebasing a series to 100 make its scale logarithmic?
No. Rebasing changes the reference level by multiplying the series by a constant. The rebased values can still be plotted on either a linear or logarithmic axis. State both the rebasing rule and the display scale when sharing the chart.
Educational information only. All worked numbers are hypothetical unless identified as a source definition. This article provides no forecast, recommendation or investment advice.