

By CrowdSent Blog Team
Historical and implied volatility describe different information. This guide shows how to compare their inputs, time horizons, and percentage units without turning the gap into a prediction.
Historical vs implied volatility: two different questions
Historical volatility measures variability in a chosen past return series. Implied volatility is inferred from option prices through a pricing model or methodology and concerns the uncertainty priced for a future period. The first starts with observed underlying prices; the second starts with market prices for options.
That difference in inputs is more important than which number is larger. A historical value of 18% and an implied value of 24% do not automatically show that somebody made a mistake. The observations cover different periods and are produced by different processes. Both also need enough methodological detail to be interpretable.
The Options Industry Council’s volatility overview explains the distinction and the role of model inputs such as the underlying price, strike, time remaining, interest rates, and volatility. A quoted implied figure is therefore conditional on more than a forecast of future price movement.
A useful starting question is: “What data went into this value, and which dates does it describe?” That question prevents a surprising number of false comparisons before any arithmetic is needed.
How the historical side is assembled
Imagine a researcher taking 21 consecutive daily closing prices. Those prices produce 20 close-to-close returns. The researcher then computes their standard deviation and, if required, converts it to an annual scale. The resulting value describes variation across that particular set of returns.
Every choice in that sentence matters. Twenty prices would produce only 19 consecutive returns. A closing-price series may omit the route taken within each session. Adjusted prices can treat distributions or corporate actions differently from raw prices. The same instrument observed at different closing times can produce different return sequences.
The window is backward-looking even when the label sounds forward-looking. “Thirty-day historical volatility” typically describes a past window; it does not say that the next 30 days will resemble it. A calm window before a scheduled announcement contains no direct observation of the announcement’s eventual effect.
Historical also means something different from “known with perfect precision.” Bad ticks, stale quotes, missing sessions, and inconsistent adjustments can distort the calculation. The raw inputs and the cleaning rules deserve as much attention as the final percentage.
How the implied side is assembled
In a standard option-model exercise, the observed option premium is known and the volatility input is solved for. The calculation asks which volatility value makes the model’s price match that premium, given its other inputs. It does not directly observe a future price path.
There may be many implied volatilities for one underlying asset. Contracts with different strikes and expirations can produce different values. A dashboard may display a selected at-the-money contract, an average, or a constant-maturity construction. The label “IV” is insufficient to identify which one you are seeing.
The Options Industry Council’s explanation of vega notes that implied volatility can change without a movement in the underlying asset. This is useful when interpreting a quiet price chart alongside changing option quotes: the two observations need not contradict each other.
Price quality also matters. If an option has a wide bid-ask spread, calculating IV from the bid, midpoint, or ask can give different answers. CrowdSent’s guide to the bid-ask spread provides the quotation background. A midpoint calculation is a convention; it is not evidence that a transaction occurred at that exact price.
A worked comparison: historical 18%, implied 24%
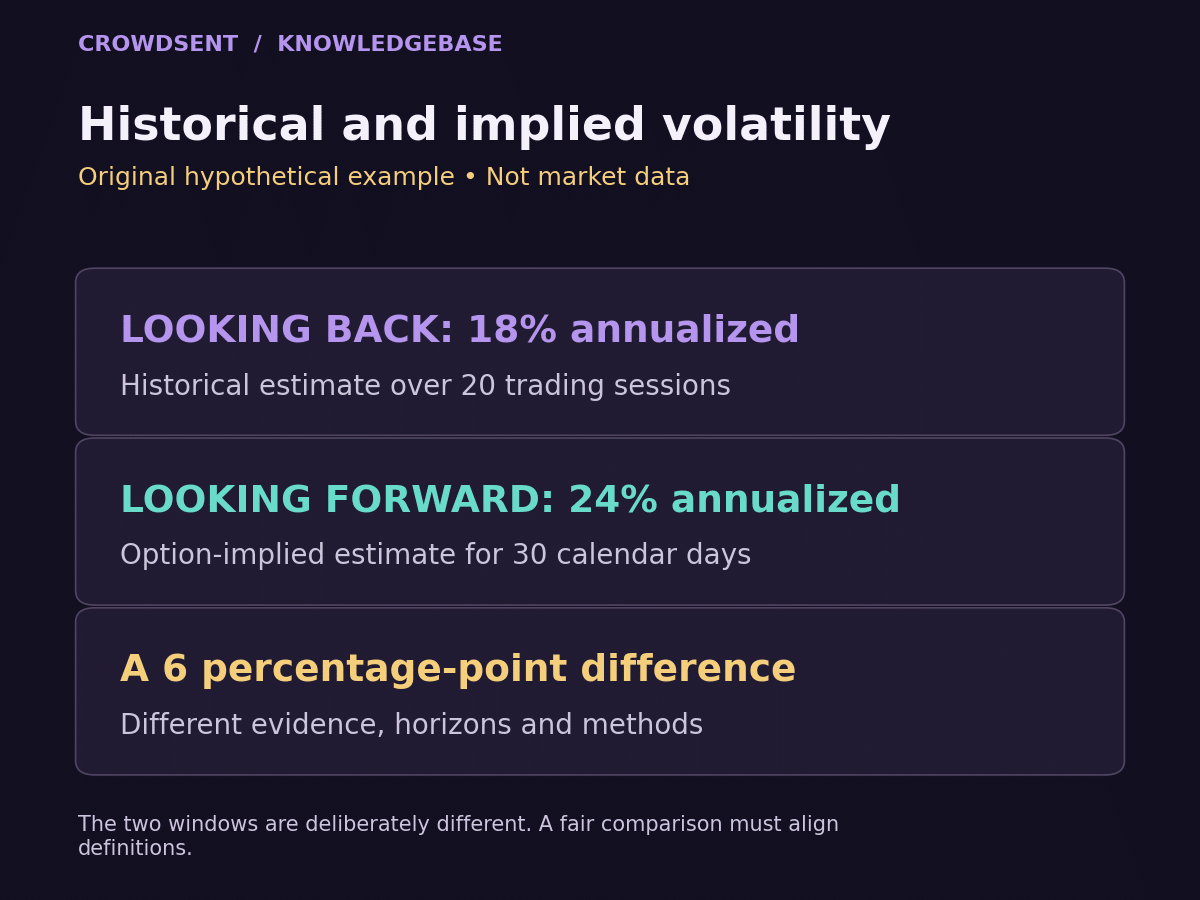
Suppose a hypothetical asset has historical volatility of 18%, annualized from its last 20 trading-session returns using a 252-day convention. On the same observation date, a specified option expiring in 30 calendar days has implied volatility of 24%, quoted on an annual scale. Record those full labels before subtracting the values.
The numerical gap is 6 percentage points: 24% minus 18%. Relative to 18%, the implied value is about 33.3% larger, because 6 divided by 18 is one-third. Calling the gap “6% higher” confuses an absolute percentage-point difference with a relative percentage change.
For scale only, the historical daily standard deviation is 18% divided by the square root of 252, or about 1.13%. Under a separate simplified calendar-time conversion, the 30-day scale associated with 24% annualized volatility is 24% multiplied by the square root of 30/365, or about 6.88%.
Those converted values describe different time lengths. Comparing 1.13% per trading day directly with 6.88% over 30 calendar days would manufacture a dramatic-looking difference out of mismatched units. Annualizing both makes their reporting scales more alike, but it still does not make their underlying windows, models, or information sets identical.
The defensible observation is narrow: the chosen option’s implied annualized volatility exceeds the chosen historical annualized statistic on that date. It would be an extra, unsupported step to conclude that the option is mispriced, that a particular strategy must succeed, or that the future realized statistic will equal 24%.
Why a gap can persist without proving a forecast
A future period may contain information that a past period does not, including a scheduled company announcement or macroeconomic release. The historical statistic cannot incorporate a future event as an observed return. Option prices can reflect the uncertainty surrounding that event before its result is known.
Option prices can also contain compensation for bearing risk. Cboe describes a tendency for SPX option-implied volatility to exceed volatility subsequently realized over long periods on its VIX educational page. That historical tendency is context, not a guarantee for any particular window or a conclusion about a different asset.
A simple counterexample shows the limit. Suppose a hypothetical implied reading of 24% is followed by realized volatility of 15%. In another period, the same initial reading is followed by 38%. The first outcome does not establish that every high implied reading is excessive; the second does not establish that every low historical reading is irrelevant.
To evaluate forecasting usefulness, a researcher needs many comparable observations and a method fixed before inspecting outcomes. One striking example is good for explaining a mechanism, but weak evidence for a general rule.
Design a fair historical comparison
Place the observation date at the center of the exercise. On its left, record the historical lookback available at that time. On its right, define the future interval whose realized variability will eventually be measured. Preserve the original implied quote, contract details, and timestamp so later revisions do not replace the evidence you actually had.
Choose consistent units and document any conversions. Decide whether returns include overnight moves, which dates count as sessions, and how holidays or missing prices are handled. If a constant-maturity implied measure is compared with an expiring option series, explain that construction difference rather than hiding it in a common chart title.
Avoid selecting only dramatic event weeks after seeing the results. A sample assembled from memorable episodes answers a different question from a regularly sampled history. Similarly, overlapping future windows share many of the same returns; treating all of them as independent observations can exaggerate the amount of evidence.
These are the same kinds of timing problems discussed in reading historical sentiment: what was observable then, what became known later, and whether a chart quietly mixes the two. Keep that distinction visible whenever testing a claim.
Write the conclusion at the right level of confidence
A strong research note contains three short parts. First, describe the measured gap with dates and methods. Second, list possible explanations without treating them as established causes. Third, say what additional evidence would distinguish those explanations.
For the example above: “The selected option’s IV was 24% against 18% historical volatility over the preceding 20 sessions. The forward period included a scheduled event. We have not yet observed that period’s realized volatility.” That statement is useful precisely because it stops where the evidence stops.
Record the eventual outcome in a market research journal using the same predefined method. Preserve both the initial observation and the later result. Rewriting an old interpretation to match the outcome destroys the opportunity to learn from the comparison.
Frequently asked questions
Is historical volatility the same as realized volatility?
The terms often overlap because both refer to variability observed in actual returns. Context matters: “historical” commonly describes a backward-looking estimate available today, while “subsequently realized” describes what occurred during a future interval once that interval has ended.
Can implied volatility be lower than historical volatility?
Yes. The selected historical window may contain an exceptional movement that option prices do not price as equally likely to repeat. Different horizons and contract choices can also matter. A lower implied figure alone does not establish that options are underpriced.
Why does an option chain show several implied volatilities?
Each contract has its own strike, expiration, and market quotation. Those differences can produce different implied values. Before referring to “the asset’s IV,” identify the selected contract or explain how the displayed summary combines information across contracts.
Does higher IV mean the market expects a price increase?
No. A volatility value concerns variability, not the sign of the eventual return. Inferring direction requires different evidence. Even a change in one call option’s IV cannot, on its own, establish the aggregate market’s directional expectation.
Can IV change while the underlying price stays unchanged?
Yes. Option prices and other model inputs can change while the underlying quote remains similar. Check that both observations have synchronized timestamps. Stale underlying or option quotes can also create an apparent discrepancy that comes from data timing.
Is a 6-percentage-point volatility gap the same as a 6% increase?
No. Moving from 18% to 24% adds 6 percentage points but represents a relative increase of approximately 33.3%. State the unit explicitly. Otherwise two people can calculate different-looking answers while describing the same pair of numbers.
Should I compare 20-day historical volatility with 30-day IV?
You can describe that comparison if you label it accurately. It is not a perfectly matched-horizon exercise. A better-designed study explains the lookback, forward horizon, annualization, and purpose, rather than presenting those two labels as interchangeable.
Does IV percentile predict future realized volatility?
A percentile describes where a selected IV reading sits within a specified history. It does not by itself evaluate future outcomes. Check the underlying series, reference window, missing-data treatment, and whether the percentile calculation changed over time.
Why might an IV calculation fail or look extreme?
Inspect the quote, bid-ask spread, time to expiry, model assumptions, and input synchronization. A tiny pricing difference can matter greatly in some contracts. An unavailable model result should remain unavailable rather than being silently replaced with zero.
What should a fair backtest preserve?
Keep the original observation date, contemporaneous option quote, contract definition, historical calculation, and predefined future measurement window. Separate information available then from data learned later. That record helps prevent hindsight from turning a weak initial claim into an apparently strong one.
Educational information only. Examples are hypothetical and are not forecasts, recommendations, or investment advice.