

By CrowdSent Blog Team
Free float market capitalization is the market value of the shares treated as available to public investors under a specified methodology. The calculation starts with equity market capitalization, then adjusts for shares excluded because of ownership or trading restrictions.
The arithmetic is straightforward. The difficult part is deciding which shares count and when a change becomes effective. Two companies with similar total market values can have very different index weights because their eligible free floats differ. This guide follows that ownership-to-weight calculation without assuming every provider uses identical rules.
All company names and numerical examples below are hypothetical.
Go to the formula, ownership exclusions, the worked example, changes over time, or the FAQs.
What is the free float market capitalization formula?
The basic formula is share price × eligible free-float shares. An equivalent version is share price × relevant shares outstanding × free-float factor. The factor expresses the eligible proportion as a decimal: a 30% eligible float corresponds to a factor of 0.30.
For example, a share price of 40 multiplied by 100 million shares produces a full equity market capitalization of 4 billion. Applying a 0.30 float factor produces a free-float capitalization of 1.2 billion. The units remain currency units, rather than shares or index points.
NSE Indices explains the application of investible weight factors to full market capitalization on its IWF resource page. A provider’s factor is an input to the index. It should be read with that provider’s ownership definitions, rounding rules, and effective date.
Which shareholdings are excluded?
Free-float methodologies commonly examine controlling, strategic, or restricted holdings. A block held to maintain control can be treated differently from a portfolio investment held by public investors. The owner’s classification and any restrictions matter more than simply whether the owner is large.
NSE Indices’ IWF guideline identifies exclusions including promoter holdings, specified related or strategic holdings, and shares locked in even when reported in the public category. It also specifies six-decimal rounding. Consequently, subtracting only the headline promoter percentage may not reproduce the official factor.
PSX’s KSE-100 methodology includes its own free-float calculation categories, such as government and controlling holdings and shares unavailable for normal trading. Those definitions are specific to the methodology; an analyst should not transfer a classification from another country without checking it.
A useful ownership worksheet has separate columns for holder, shares, classification, evidence date, and inclusion decision. Make the categories mutually exclusive when adding exclusions. A strategic block that is also locked in must not be deducted twice.
Worked example: the smaller company receives the larger weight
Build the share bridge
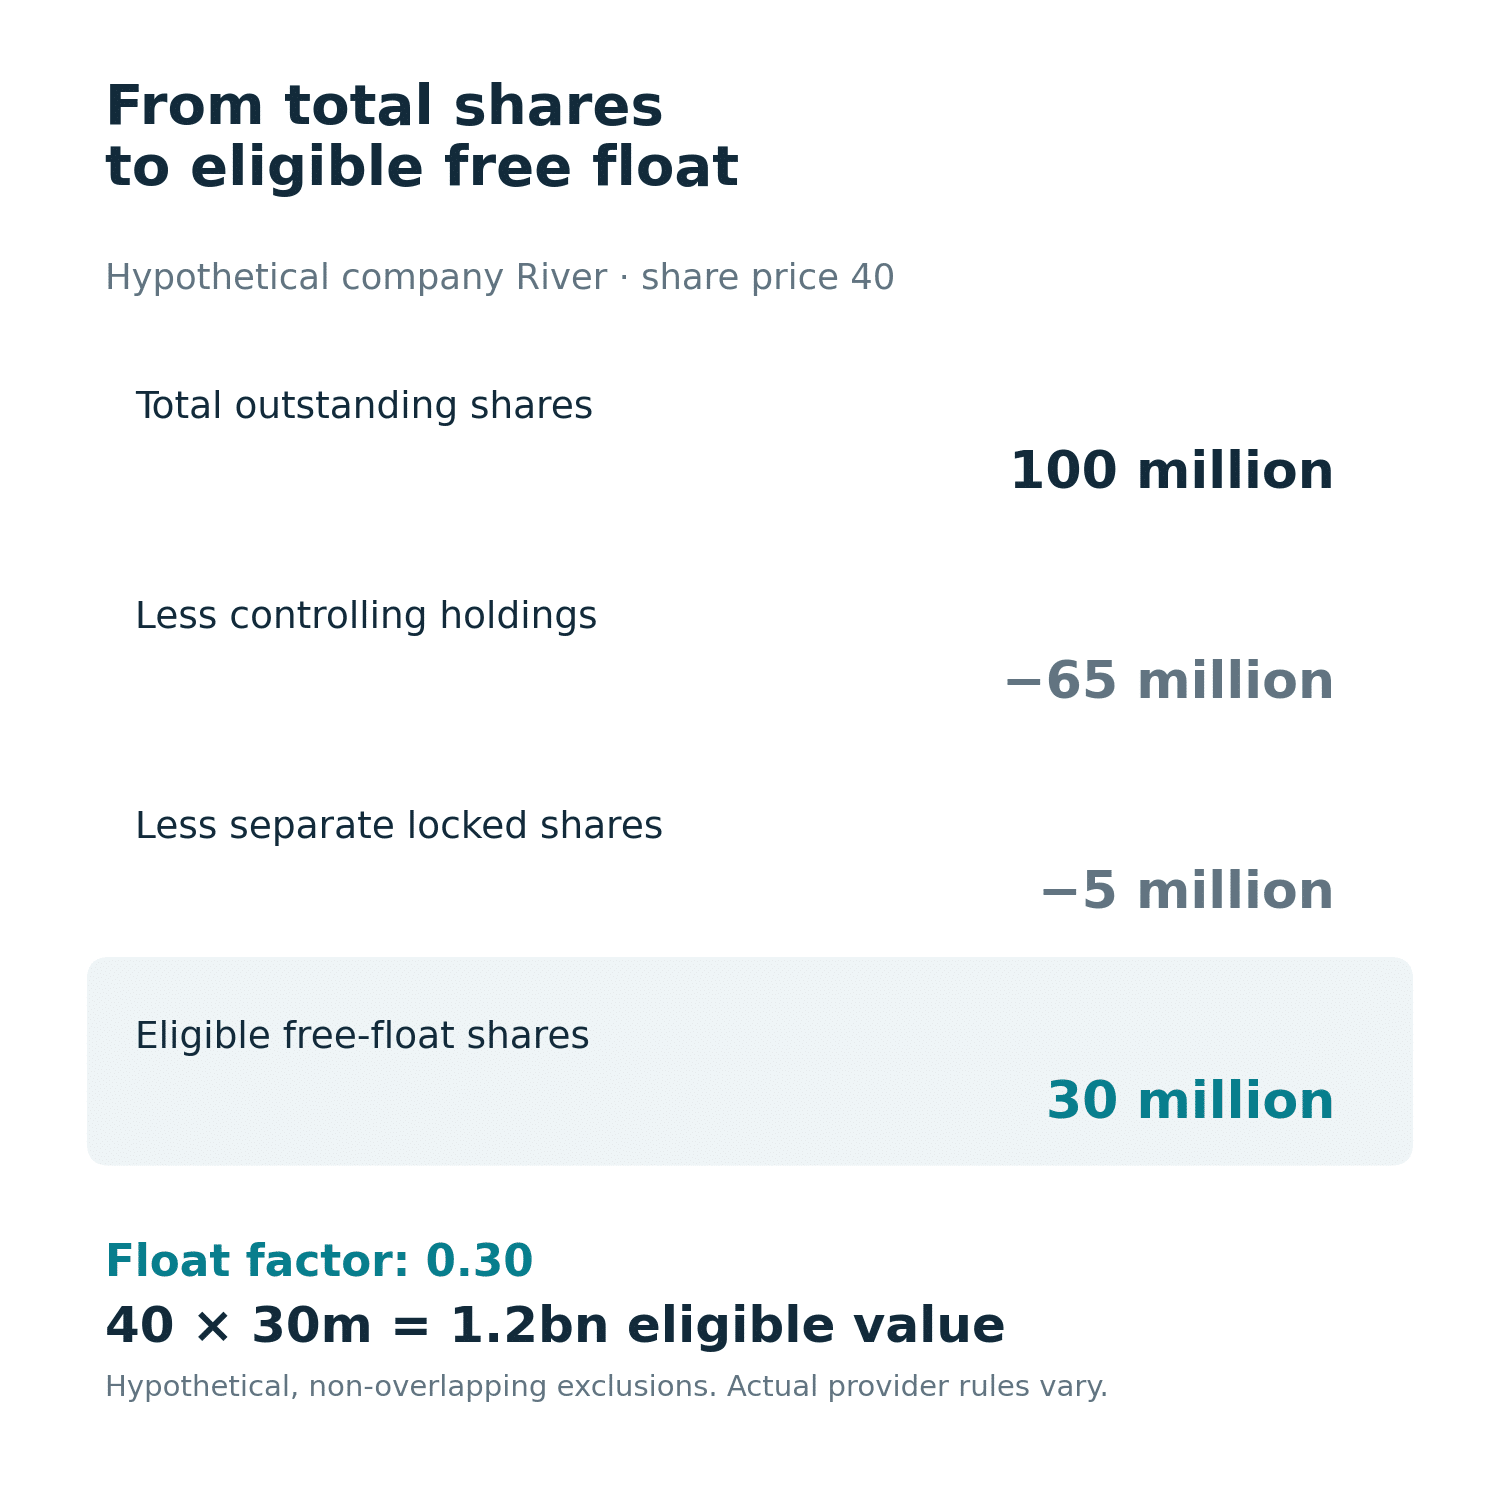
River has 100 million relevant outstanding shares priced at 40. In this hypothetical methodology, 65 million belong to a controlling group and a separate 5 million are locked in. Assume all remaining shares qualify as free float and there are no additional restrictions.
Eligible float is 100 million − 65 million − 5 million = 30 million shares. The factor is 30 million ÷ 100 million = 0.30. River’s full market capitalization is 4 billion; its free-float capitalization is 40 × 30 million = 1.2 billion.
Harbor has 80 million relevant outstanding shares priced at 25. Its total capitalization is 2 billion. Assume 80% qualifies as free float, giving 64 million eligible shares and a free-float capitalization of 25 × 64 million = 1.6 billion.
Convert eligible value into weights
If an uncapped index contains only River and Harbor, the total eligible capitalization is 1.2 billion + 1.6 billion = 2.8 billion. River’s weight is 1.2 ÷ 2.8, or approximately 42.86%. Harbor’s weight is 1.6 ÷ 2.8, or approximately 57.14%.
River is twice Harbor’s size by full equity capitalization but receives the smaller free-float weight. The result comes from ownership availability, not a claim that River is a weaker business or Harbor a better investment.
For comparison, full-cap weights would be approximately 66.67% for River and 33.33% for Harbor. Keeping both sets of weights beside the ownership bridge makes the source of the difference visible. A price chart alone could not provide this explanation.
Read the denominator as carefully as the numerator
The weight is a relative measure. If Harbor’s eligible value changes while River’s does not, River’s index weight still changes because total eligible capitalization changes. A reported weight increase therefore does not always mean more of River’s shares became available.
For example, if Harbor’s eligible capitalization falls to 1.2 billion while River stays at 1.2 billion, both weights become 50%. River’s own free-float value has not increased. This is a denominator effect, and it is easy to miss when reading only a constituent-weight column.
How does free-float capitalization change over time?
There are three broad inputs to inspect: price, the relevant share count, and the eligible fraction. A change in any one can alter free-float capitalization. They represent different events, so a useful explanation identifies the moving input rather than calling every increase a share-price gain.
Return to River. If its price rises from 40 to 44 and its 30 million eligible shares stay unchanged, free-float capitalization rises from 1.2 billion to 1.32 billion, a 10% increase. That is a price-driven change under the example’s fixed share assumptions.
Alternatively, keep the price at 40 and suppose 10 million previously excluded shares become eligible, bringing the factor to 0.40. Free-float capitalization becomes 1.6 billion. The company’s share price and full capitalization have not changed. The additional eligible value is an index-input change, not a 33.33% shareholder return.
A provider may incorporate that change at a review or under an event-specific policy. The date an ownership event occurs, the date information is published, and the date the factor enters the index need not be identical. A current price combined with an outdated float factor can answer a different question from the official index calculation.
Reclassify a holding without issuing another share
Take a separate scenario using River’s original 100 million shares, price of 40 and 30 million eligible shares. Suppose a restriction expires on 3 million of the separate 5 million locked shares. Under this hypothetical provider’s rules, those shares become eligible at the next review; the holder and total shares remain unchanged.
At implementation, excluded shares are 65 million controlling shares plus 2 million still locked, leaving 33 million eligible. The factor rises from 0.30 to 0.33. That is a three-percentage-point increase in the float percentage, but eligible capitalization rises 10%, from 1.2 billion to 1.32 billion.
Full capitalization remains 4 billion. An unchanged holding of 1 million shares still represents 1% of the company, so this reclassification creates no share-count dilution. If Harbor stays at 1.6 billion eligible value, River’s index weight becomes 1.32 ÷ 2.92, approximately 45.21%. Verify the actual provider’s exclusion and effective-date rules: expiry alone does not establish eligibility under every methodology.
Why can providers publish different free-float measures?
Methodologies can differ in their treatment of strategic investors, thresholds, rounding, share classes, and foreign ownership restrictions. The intended investor universe also matters. A domestic benchmark and an international-investability benchmark may ask different questions about the same company’s shares.
S&P DJI’s Float Adjustment Methodology distinguishes strategic holdings from foreign ownership limits and explains that the application of those limits differs across index families. A general public-float percentage should therefore not be substituted automatically for an international index’s investability factor.
When two figures disagree, preserve their labels. Compare the security or share class, share-count date, factor definition, and effective date before deciding one is erroneous. A rounded screen value and a detailed calculation file can also differ slightly without reflecting a substantive disagreement.
Does a high free float guarantee liquidity?
No. Free float estimates eligible ownership availability. Liquidity concerns the ability to transact in a particular quantity under current market conditions. Shares can qualify as float even when their owners have no intention of offering them for sale today.
A company could have a large eligible float and a thin order book at a particular time. Conversely, a smaller float may turn over actively. The distinction in liquidity versus volume is useful here: neither the stock of eligible shares nor past trading activity guarantees an executable price for a new order.
A free-float figure also does not tell you the bid-ask spread. That is a quote-level measure, explained in our bid-ask spread guide. Keep ownership structure, trading activity, and current quotes in separate columns rather than treating them as interchangeable.
A practical reconciliation before using the number
First confirm the unit and security. A price for one share class needs the matching shares and float factor. Then check whether the share count is in units, thousands, or millions. Mixing a millions-based count with a units-based total creates an enormous error even when every displayed input looks plausible.
Next, reconcile excluded holdings without overlap and record the applicable provider’s factor. Finally, compare dates and explain which input changed since the prior observation. The market research journal template can hold that short audit trail and the supporting disclosure links.
Frequently asked questions
1. Is free-float capitalization the same as total market capitalization?
Only if every relevant share is counted as eligible float under the methodology. Otherwise free-float capitalization is lower. Both use a share price, but they value different share quantities and should retain distinct labels.
2. Is free float the same as shares traded today?
No. Free float is a share-availability measure at a point in time. Trading volume counts activity over a period, and a share can trade more than once. Today’s volume cannot be substituted for the eligible share count.
3. Are all public-category shares necessarily free float?
No. A methodology can exclude specified public-category holdings because of lock-ins, strategic relationships, or other restrictions. Read the detailed classification rules rather than treating the broad public label as a complete index calculation.
4. Are all institutional holdings excluded?
No. The treatment depends on the holder’s role, rights, restrictions, and the provider’s rules. A large portfolio holding and a strategic controlling stake can receive different classifications. Size alone is not a universal exclusion test.
5. Does a float increase mean the company issued new shares?
Not necessarily. Existing excluded shares may become eligible after a sale or release from a restriction. The total share count can stay unchanged while the float factor rises. Check the underlying ownership event.
6. Can free-float capitalization rise while price is unchanged?
Yes. The relevant share count or eligible fraction can increase. River’s hypothetical factor increase from 0.30 to 0.40 does exactly that. It changes eligible value without establishing any return from a share-price movement.
7. Does a 40% free float mean a 40% index weight?
No. The float percentage applies within the company. Index weight compares that company’s eligible value with the eligible value of all constituents, subject to any additional rules. These percentages have different denominators.
8. Does a higher free-float weight imply a recommendation?
No. It records a company’s representation under a measurement rule. It does not evaluate suitability, future returns, or whether the share price is attractive. Eligibility and weighting are separate from investment judgment.
9. Why might my calculation differ slightly from the factsheet?
Possible causes include rounding, different price timestamps, share-class scope, and factor updates. Check those inputs before attributing the difference to a mistake. A factsheet may also use a date earlier than the day you downloaded it.
10. Can token circulating supply be used as the same concept?
It is a separate definition. Equity free-float rules classify shares and ownership under an index methodology. A token provider’s circulating-supply rules can use different exclusions and evidence. Any cross-asset comparison needs its own clearly stated supply basis.
Conclusion: verify the shares behind the weight
Free float market capitalization becomes useful when the ownership bridge is visible. Establish the share count, remove the correct exclusions once, apply the factor at the right date, and compare eligible values using the same rules. That process explains why a company’s total size and its index influence can diverge.
This article provides general education, not financial advice.
Source documentation checked 11 October 2026. Educational explanation from the CrowdSent Blog Team. Numerical examples are hypothetical unless explicitly identified otherwise. This article does not provide investment recommendations.