

By CrowdSent Blog Team
A crack spread is a price comparison between selected refined petroleum products and the crude oil used as their reference input. It provides a simplified view of the gross price margin around refining. The calculation becomes useful only when the products, crude benchmark, units, quantities and delivery periods are clearly specified.
A positive crack spread does not establish a refinery’s net profit. Real operations have additional costs, different product yields and location-specific prices. This guide shows how to calculate the commonly discussed 3-2-1 version and identify what the resulting number leaves out.
What is a crack spread measuring?
The idea is straightforward: compare the value of a chosen product basket with the cost of a chosen crude basket. The difference summarizes how those prices relate at a particular observation time. It is called a crack spread because refining includes processes that break larger hydrocarbon molecules into smaller ones, although the benchmark calculation is not a physical refinery simulation.
CME’s introduction to crack spreads explains why different product ratios are used. A refinery’s output depends on its configuration, feedstock and product requirements. A standardized basket provides a repeatable comparison; it cannot reproduce every plant’s actual economics.
Start by stating which comparison you mean. A gasoline crack and a distillate crack can move differently. A U.S. futures-based spread also differs from a physical margin estimated using a particular refinery’s delivered crude and regional product sales prices.
The most useful question is therefore not simply “Did the crack spread rise?” Ask which crude, which products, which period and which location underpin the calculation. Without that label, two analysts can discuss different series while appearing to disagree about the same number.
How the 3-2-1 crack spread formula works
The 3-2-1 convention compares three barrels of crude with two barrels of gasoline and one barrel of distillate. It is a simplified product mix. It does not claim that every three physical barrels entering every refinery become exactly those three barrels of output.
For prices already expressed in dollars per barrel, the calculation is: two times the gasoline price, plus one times the distillate price, minus three times the crude price. Divide that basket difference by three to express the result per barrel of crude input.
Leaving out the final division produces the margin for the three-barrel basket rather than the per-barrel headline. Both quantities can be calculated, but they must carry different labels. Confusing them creates a threefold error without changing any of the underlying prices.
Convert product quote units first
Product quotes often need conversion before entering the formula. A petroleum barrel contains 42 U.S. gallons, as defined in the EIA glossary. A product price in dollars per gallon is therefore multiplied by 42 to obtain dollars per barrel.
If a feed instead shows cents per gallon, divide by 100 as well. For example, 250 cents per gallon is $2.50 per gallon, which converts to $105 per barrel. Multiplying 250 directly by 42 and treating the result as dollars creates a hundredfold unit error.
CME’s crack conversion calculator illustrates the product-price conversion and the theoretical margin convention. For an independently built worksheet, keep the original quotes and the converted prices in separate fields so the arithmetic can be checked.
Worked example: calculate a hypothetical 3-2-1 margin
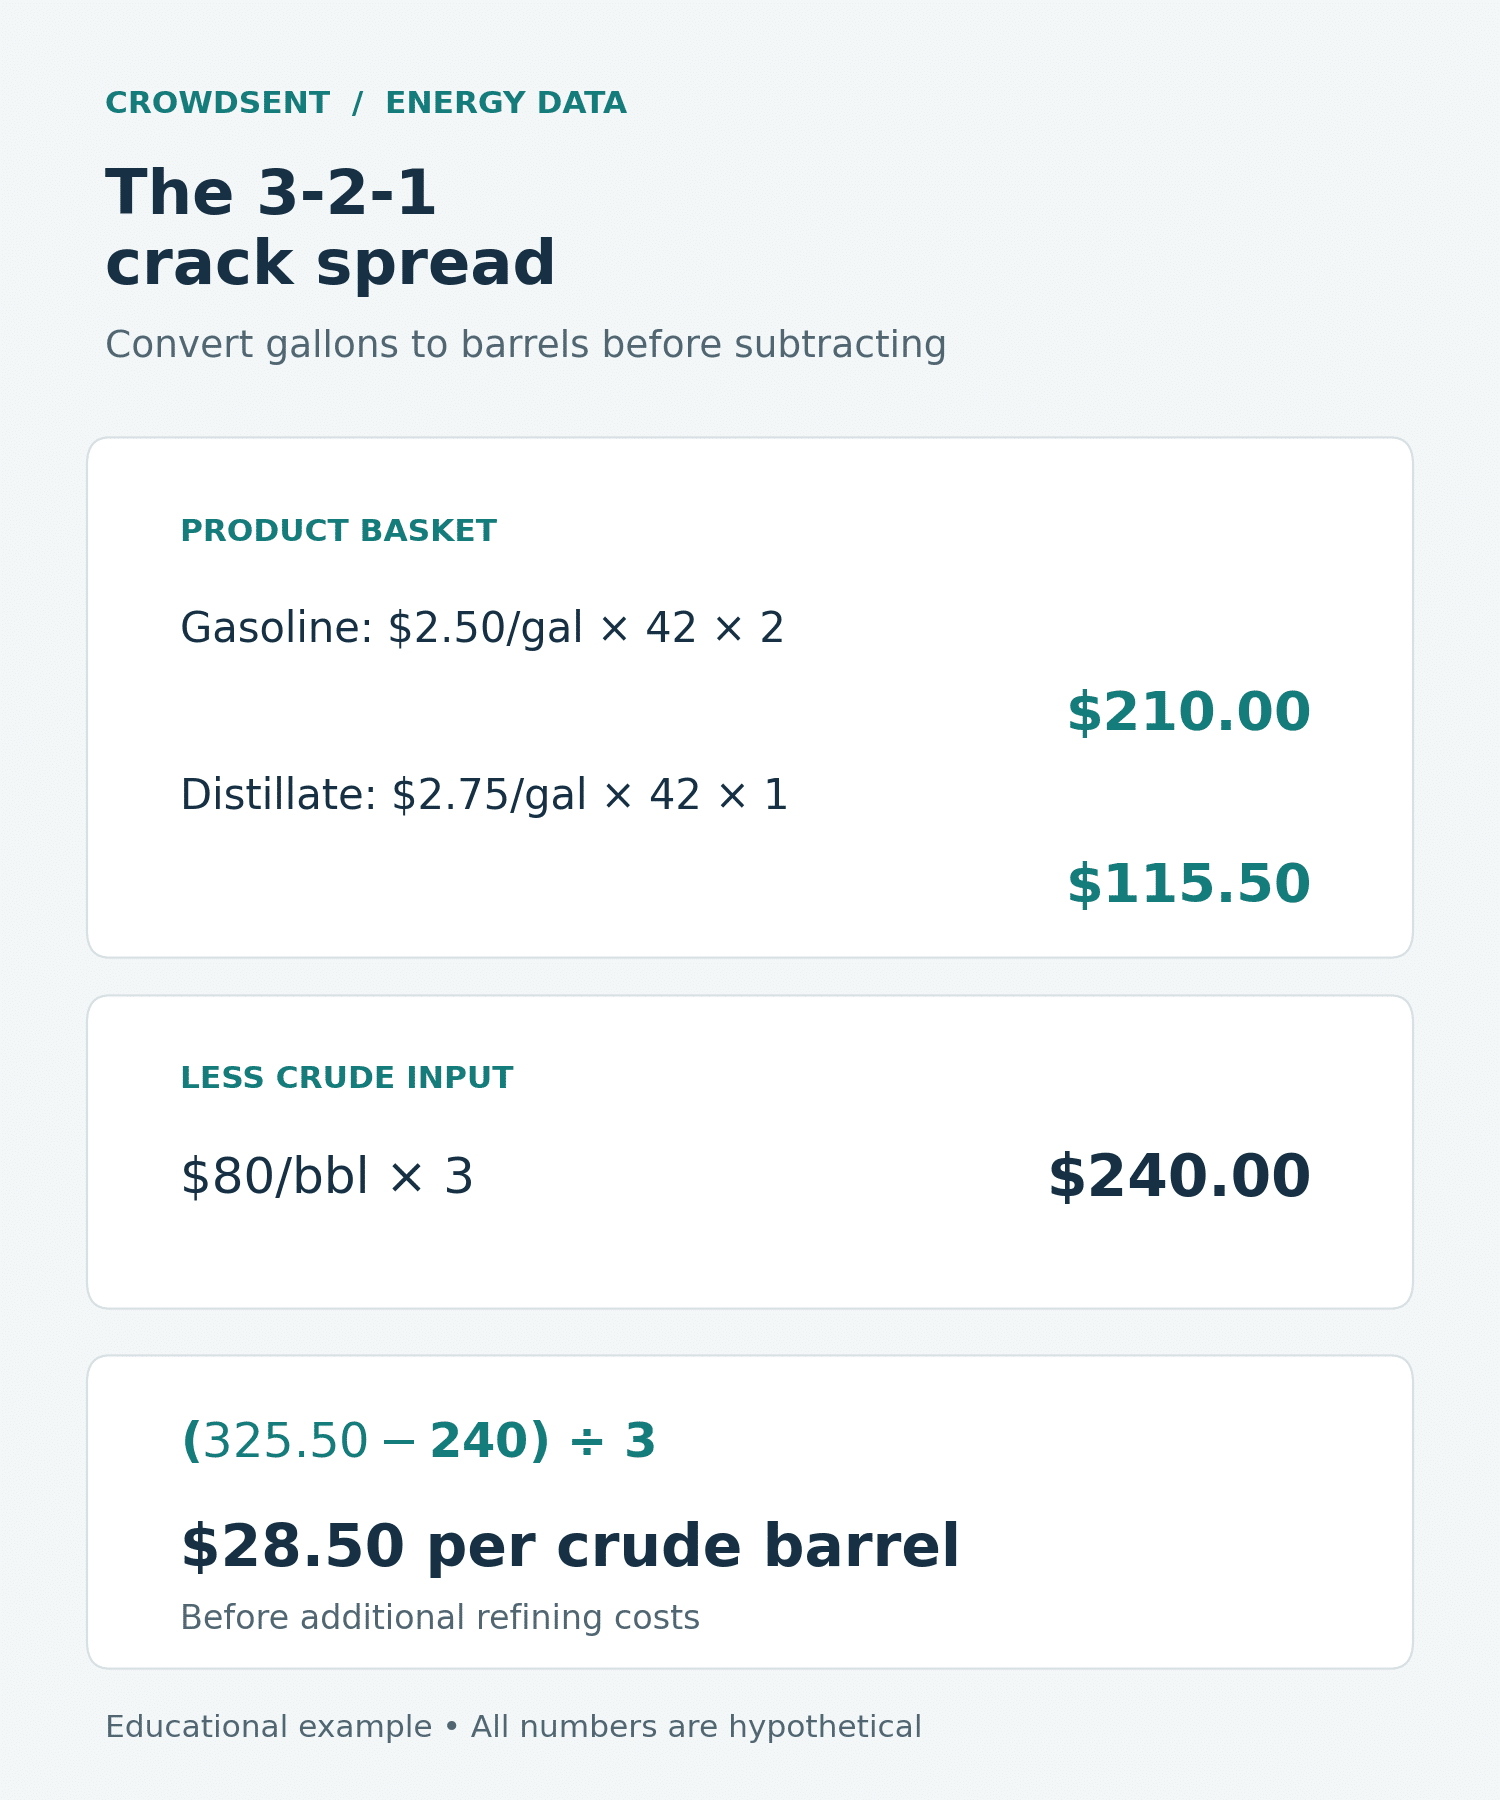
Assume three synchronized hypothetical prices for comparable delivery periods: crude at $80 per barrel, gasoline at $2.50 per gallon, and distillate at $2.75 per gallon. These are invented teaching inputs, not current market quotes.
First convert gasoline: $2.50 multiplied by 42 equals $105 per barrel. Distillate converts to $2.75 multiplied by 42, or $115.50 per barrel. The two-barrel gasoline component is therefore worth $210, while the one-barrel distillate component is worth $115.50.
The three-barrel product basket is worth $325.50. The three-barrel crude basket costs $240. Their difference is $85.50 for the basket. Dividing by three gives a hypothetical 3-2-1 crack spread of $28.50 per barrel of crude input.
That result is a price-margin estimate before the additional costs and differences associated with an actual refinery. It is not a reported company earnings figure, a return on invested capital or cash that a reader could obtain without taking other risks.
Test what happens when one input changes
Hold the product prices fixed and increase crude from $80 to $85. The crude basket now costs $255, so the basket difference falls to $70.50. Divide by three and the spread becomes $23.50 per barrel. A $5 rise in the crude reference compressed this particular margin by $5.
Return to the original crude price and instead increase gasoline by $0.10 per gallon. That adds $4.20 per gasoline barrel. Because gasoline has a two-barrel weight, the basket gains $8.40; dividing by three increases the headline spread by $2.80.
An equal $0.10-per-gallon rise in distillate adds only $4.20 to this basket, increasing the headline by $1.40. The difference comes entirely from the selected weights. It does not establish that gasoline is inherently twice as important in every refinery or market.
This sensitivity exercise makes the construction visible. When the spread changes, you can attribute the arithmetic contribution to each leg before trying to explain the economic cause. Keep that calculation separate from a claim about why the individual prices moved.
Why a crack spread is different from net refining profit
The benchmark omits the detailed operating account. A real assessment would need energy and operating costs, maintenance, transportation, losses, financing and other relevant expenses. It would also need the refinery’s actual input and output mix rather than assuming that the benchmark basket fits perfectly.
Consider a deliberately simplified extension of the example. Suppose an analyst assigns $12 per barrel to a selected set of additional costs. Subtracting that amount from $28.50 leaves $16.50. Even this adjusted number is only as complete as the cost list; it should not be labeled net profit if important costs or revenues remain outside it.
Different crude quality also complicates the comparison. A refinery buying a grade at a discount to the chosen benchmark may have different processing requirements and product yields. The discount cannot automatically be treated as an equal addition to earnings.
For company analysis, reconcile the benchmark with the company’s own disclosed margin definition, period and business mix. A futures-based daily observation and a quarterly financial metric can differ without either being incorrect. Their boundaries and timing are different.
Align location, delivery months and observations
A crack calculation can mix unlike inputs even when every price is accurate. Check whether the crude and products refer to comparable delivery periods and the intended pricing locations. If one leg rolls to another month before the others, the spread may change partly because its composition changed.
Use synchronized observations or a clearly stated settlement convention. Subtracting one market’s current quote from another market’s older settlement introduces a timing difference. Preserve the exact instrument identifiers rather than relying on generic labels such as “oil” and “gasoline.”
If you are reviewing an executable quote, remember that a mid-price calculation does not show the cost of buying and selling each leg. CrowdSent’s bid–ask spread guide explains the distinction between a displayed reference and the available transaction prices.
Contract quantities need a separate check too. Price weights are not automatically position sizes across every product offered by every venue. The guide to contract size and units is useful when you need to understand exposure rather than just calculate an educational price series.
Use the spread to frame a research question
A wider crack spread can prompt questions about relative product strength, crude weakness or a combination of the two. Inspect the component prices first. Then compare the observation with relevant processing, inventory and demand evidence.
A refinery interruption, for example, could plausibly affect the input and product sides differently. That is a hypothesis to investigate with dated operational evidence, not a conclusion supplied by the spread itself. Likewise, a wider spread does not prove that utilization will immediately increase; operating constraints may prevent a response.
Save the basket definition, converted inputs and component contributions in a market research journal. An explanation you can reproduce is more useful than a broad claim that “refining margins are strong” without naming the underlying measure.
Frequently asked questions
1. What does a positive crack spread mean?
The selected product basket has a higher price value than the selected crude basket under the stated formula. Additional costs and real-world differences still need to be considered. A positive benchmark spread alone does not demonstrate a profitable refinery operation.
2. What does a negative crack spread mean?
The formula values the selected products below the crude reference. Check the input units, dates and basket before interpreting it. Even a correctly calculated negative spread describes that benchmark comparison rather than every refinery’s realized results.
3. What is the difference between 1-1 and 3-2-1 cracks?
A 1-1 comparison uses one product against one unit of crude. A 3-2-1 comparison uses a weighted basket of two gasoline barrels and one distillate barrel against three crude barrels. The chosen weights change the sensitivity to each product price.
4. Why is the 3-2-1 result divided by three?
The numerator calculates a difference for a three-barrel input basket. Dividing by three expresses the result per barrel of crude. If you retain the undivided value, label it as the basket difference rather than the per-barrel spread.
5. Why multiply a gasoline price by 42?
That converts dollars per U.S. gallon into dollars per petroleum barrel. If the source uses cents per gallon, also convert cents to dollars. Write the units at each step so a numerical input is not mistaken for a different denomination.
6. Can crack spreads rise while crude oil falls?
Yes. If product prices hold steady while the crude reference falls, the calculated margin widens. Look at every component before describing the change; a wider margin need not reflect rising fuel prices.
7. Is a 3-2-1 crack an exact refinery yield model?
No. It is a standardized comparison. Actual yields depend on the plant and the materials processed. Use the benchmark to organize relative prices, and use plant-specific information when the question concerns a particular refinery.
8. Can I substitute Brent for WTI?
You can calculate a clearly labeled alternative basket. That changes the reference and may change its relevance to the products and location studied. Do not compare the result with a WTI-based series as though the construction were unchanged.
9. Does the crack spread equal a refining company’s earnings?
No. Company earnings incorporate actual transactions, additional costs, timing and other business activities. A benchmark spread can inform a question about operating conditions, but it cannot replace the company’s financial disclosures.
10. What should I check when my calculation differs from a website?
Compare the crude reference, product selection, weights, quote units, contract months and timestamps. Also check whether the displayed result is per barrel or per basket. Many apparent disagreements can be traced to one of those construction choices.
Conclusion: make the basket explicit
A useful crack spread has a clear definition and auditable inputs. Convert the units, apply the weights and retain the component prices before interpreting the result. The calculation can illuminate relative prices while leaving real refinery profitability as a separate, more detailed question.
This article is educational and does not recommend a trading strategy.
Source documentation checked 11 October 2026. Educational explanation from the CrowdSent Blog Team. Numerical examples are hypothetical unless explicitly identified otherwise. This article does not provide investment recommendations.