

Continuous futures charts combine successive dated contracts into a longer history. The chart can be useful for research, but its displayed symbol does not by itself identify one contract that existed for the whole period. A provider must decide which contract supplies each observation and how to handle price differences when that selection changes.
Those decisions explain why two apparently identical charts may disagree. They also explain why an old chart level can change after a later roll. The first task is to identify the construction method, then decide which comparisons the resulting series can support.
What a continuous futures series contains
A dated futures contract has a particular expiry and contract specification. A continuous series links observations from a sequence of those contracts. Each historical bar therefore needs a mapping: which underlying contract supplied its price?
CME’s Continuous Price Series documentation illustrates the distinction between a front-contract view and an active-contract view. Its daily series uses underlying settlement prices. That is one documented product; other providers can make different choices.
“Continuous” does not necessarily mean “back-adjusted.” A series can be uninterrupted in time while retaining a visible price step at a contract switch. Nor does it mean a perpetual derivative with no scheduled expiry. The underlying contracts in this discussion still expire.
Two separate decisions: mapping and adjustment
Mapping selects the contract. A rule may switch a fixed number of business days before expiry, use a calendar schedule, or respond to a volume or open-interest crossover. The rule also needs to explain which later maturity is eligible.
Adjustment determines whether selected historical prices are changed to account for the price gap between old and new contracts. This can be independent of the mapping rule. Two datasets can roll on the same date yet use different adjustments.
QuantConnect’s futures data documentation treats mapping and normalization as separate settings. Keep that separation in your notes even if a charting interface combines them into one menu.
For an activity-based rule, timing matters. A rule using today’s complete session volume cannot be known at today’s open. A historical simulation that assumes otherwise may use information unavailable at its stated decision time. A good specification says when the input becomes known and when the switch takes effect.
A hypothetical roll with no market move
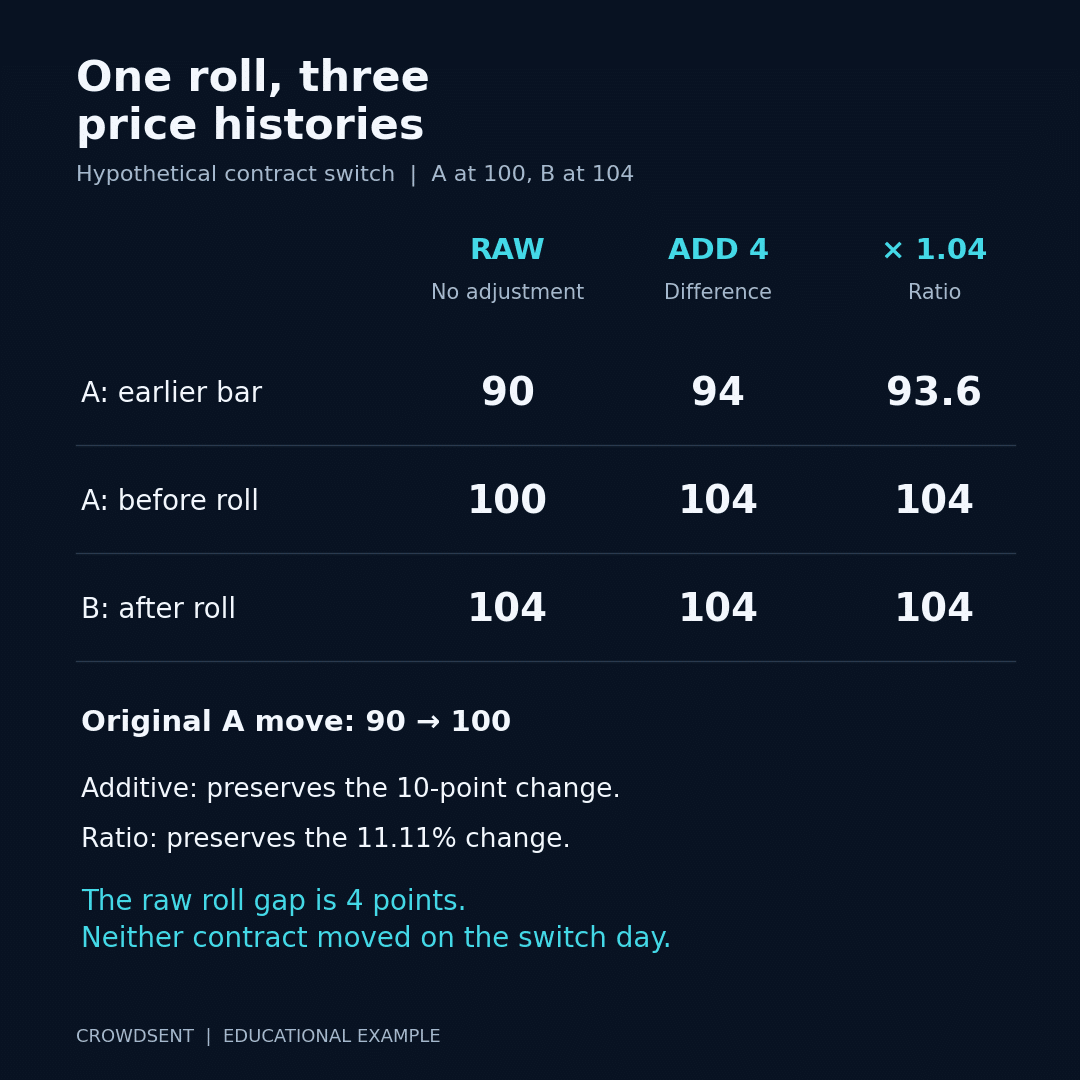
Hypothetical example: Contract A settles at 100 on Tuesday. Contract B settles at 104 on Tuesday. On Wednesday, both contracts settle at the same prices again. A data provider switches its continuous series from A to B for Wednesday.
An unadjusted continuous chart shows Tuesday at 100 and Wednesday at 104. The apparent 4% increase comes entirely from changing the selected contract. Neither A nor B rose between the two observations.
This does not make either contract price wrong. It means the two adjacent chart bars describe different instruments. Calling the step a market rally would answer the wrong question.
Now suppose B actually settles at 105 on Wednesday. The continuous chart goes from 100 to 105, while the like-for-like change in B is from 104 to 105. The displayed step combines a four-point contract difference with a one-point move in the newly selected contract.
Difference adjustment changes historical price levels
In a simple backward difference adjustment, add the roll-date price gap to earlier observations so that the old segment meets the new one. In our example, add four points to Contract A’s earlier prices. Tuesday’s adjusted value becomes 104 and Wednesday’s actual B value remains 104 in the no-move case.
Suppose A previously rose from 90 to 100. Adding four produces an adjusted move from 94 to 104. The ten-point change survives, but the percentage changes differ: 10 ÷ 90 is about 11.11%, while 10 ÷ 94 is about 10.64%.
That arithmetic shows why difference-adjusted levels cannot automatically stand in for original traded prices or original percentage returns. The transformation preserves a different property.
TradingView’s back-adjustment documentation provides one provider-specific implementation using the difference between old and new contract closes near the switch. The precise reference bar matters, so retain the methodology rather than assuming all platforms use the same formula.
Ratio adjustment preserves a different relationship
A simple backward ratio adjustment would multiply the older segment by 104 ÷ 100, or 1.04. The earlier 90 becomes 93.6, and 100 becomes 104. The adjusted percentage increase is 10.4 ÷ 93.6, still about 11.11%.
The point increase is now 10.4, however, rather than the original ten. Multiplying that adjusted point change by the original contract multiplier would not reproduce the original dollar gain.
Neither transformation is a universal answer for every research question. An additive method changes percentage relationships; a multiplicative method changes point relationships. Zero or negative values also require particular care with ratios and logarithms. Check the provider’s treatment rather than forcing a formula across unsuitable data.
With repeated backward adjustments, a later roll can change older displayed values again. An archived screenshot and a newly downloaded history may therefore differ even if the underlying historical trades were never corrected.
A smooth chart is not an account return
Consider the no-move example again. An account holding A through Tuesday and replacing it with B at their stated prices has not earned four points merely because a raw chart stepped upward. Its gains and losses depend on the contracts actually held and their entry, exit and settlement values.
A back-adjusted chart can remove that visual step without including commissions, bid-ask spreads, cash balances, interest or the timing of real executions. A rolling-return index may explicitly incorporate some of those assumptions, but its methodology must say which.
CME’s expiration and settlement overview explains the dated contract lifecycle. A chart switch is a data operation; an actual roll requires closing or offsetting one exposure and establishing another. One does not prove the other occurred.
Check volume, open interest and missing bars separately
Price adjustment does not tell you which activity series is attached. Volume may belong to the selected maturity or summarize several maturities. Open interest can follow a different reporting timetable. Read the field definitions before combining either with continuous prices.
Our open interest vs volume guide explains why those two measures answer different questions. The missing market data checklist is useful when a dataset fills gaps or carries an earlier observation forward.
In particular, a repeated close does not establish that the contract traded at that value throughout the session. Retain any flags for estimated, carried-forward or missing data.
Keep a compact data specification
- Record the provider, symbol, download date and data version.
- Name the selected contract depth and the rule for moving to the next contract.
- Specify when the rule’s inputs are available.
- Record raw, difference-adjusted or ratio-adjusted treatment and its reference price.
- Retain individual contract identifiers and unadjusted prices when available.
- Check session hours, timezone, settlement versus close, and volume coverage.
- State whether the intended calculation uses price points, percentages or a simulated account ledger.
Adding these details to a market research journal makes differences between charts explainable rather than mysterious.
Frequently asked questions
1. Can I place an order for a continuous symbol?
That depends on the platform’s routing interface. The historical series itself is a construction. Any executable order must resolve to a tradable instrument, so verify the full contract month in the order details rather than relying on the chart label.
2. Is the nearest expiry always the active contract?
No. Trading activity may move to a later month before the nearest contract expires. Front and active labels describe different selection concepts, and a provider’s active rule may use a preset schedule rather than a live crossover.
3. Why did a historical high change?
A later backward adjustment may have shifted or scaled older bars. Data corrections are another possibility. Compare the adjustment setting, roll history and raw contract prices before deciding the historical market record changed.
4. Does a roll gap represent an overnight gain?
Not by itself. The adjacent bars may reference different maturities. Compare both contracts on the same date, then measure each contract’s own price change to distinguish a roll gap from actual movement.
5. Does back-adjustment remove every source of error?
No. It addresses the chosen roll gap. Incorrect mappings, stale prices, incompatible sessions and missing observations can remain. A smooth line is a presentation property, not a complete data-quality test.
6. Can additive adjustment produce negative old prices?
Yes, cumulative offsets can move an old adjusted value below zero even when that original contract observation was positive. That value belongs to the constructed series and should not be presented as proof of an actual negative trade.
7. Can I use adjusted prices to estimate contract notional value?
Use the actual relevant contract price and its specification for that calculation. An adjusted historical level may have been shifted or scaled, so applying an unchanged multiplier can produce a synthetic amount.
8. Why do indicators differ between providers?
An indicator consumes the supplied prices. Different roll dates, adjustments, sessions or missing-data treatments change those inputs. Compare the series construction before comparing indicator settings or drawing conclusions about the discrepancy.
9. Is a perpetual contract a continuous futures series?
No. A perpetual derivative is a distinct product with its own rules. A continuous series is a way to represent multiple dated contracts over time. Similar-looking chart symbols do not make their settlement mechanisms equivalent.
10. What should accompany a backtest using continuous data?
Disclose mapping, adjustment, information timing and the method for translating signals into actual dated-contract positions. Include execution and cost assumptions. Otherwise readers cannot tell whether a result reflects contract performance or the way the history was stitched.
Keep the research process consistent
To explore the workspace and its membership options, open CrowdSent.
Educational note: This article explains market concepts for research. It is not investment advice or a recommendation to trade. Futures involve leverage and can produce losses greater than the amount initially deposited.