

Contango vs backwardation describes the relationship between futures prices for different delivery or settlement dates. When later contracts are more expensive than nearby contracts, that part of the curve is in contango. When nearby contracts are more expensive, it is in backwardation.
The comparison is a snapshot across maturities. A rising line on a chart of yesterday’s and today’s prices answers a different question. To read a futures curve accurately, start with matching contracts, one observation time and a clearly stated subtraction order.
This guide focuses on the curve within a futures market. It does not attempt to value a commodity, recommend a calendar-spread position or forecast the price of a particular contract.
Contango vs backwardation starts with the horizontal axis
A futures curve plots contract maturity on the horizontal axis and price on the vertical axis. Every point should refer to a comparable contract observed at the same time. The curve can slope upward, downward or change direction between different months.
Descriptions sometimes compare a futures price directly with a spot price. That convention is useful when the spot reference is genuinely comparable. For a curve made only from futures, state the near and deferred contracts instead. CME’s explanation of contango and backwardation connects these relationships with carrying costs and the benefit of having physical inventory available.
A bond yield curve has a different vertical axis: yield. A futures curve normally shows contract prices. Similar-looking slopes do not make their economic interpretation interchangeable.
Build a like-for-like contract comparison
The commodity name alone is insufficient. Two oil contracts can differ in grade, location, settlement method or contract size. A price difference between them may reflect those terms as well as maturity.
Check these fields before plotting the curve:
- Product and venue: use one specified futures product and exchange.
- Contract month: retain the full month and year, not just a generic front-month label.
- Quote units: confirm the currency and whether the price is per barrel, ounce, bushel, index point or another unit.
- Settlement terms: identify the delivery location, grade or reference benchmark.
- Price field: compare settlements with settlements or synchronized executable quotes with each other.
- Timestamp: use one trade date and consistent observation time.
The CFTC’s overview of futures contract design explains why standardized quantity, quality, location and dates matter. For arithmetic, our guide to pips, lots and contract size helps keep price units separate from monetary exposure.
A hypothetical curve and its calendar spreads
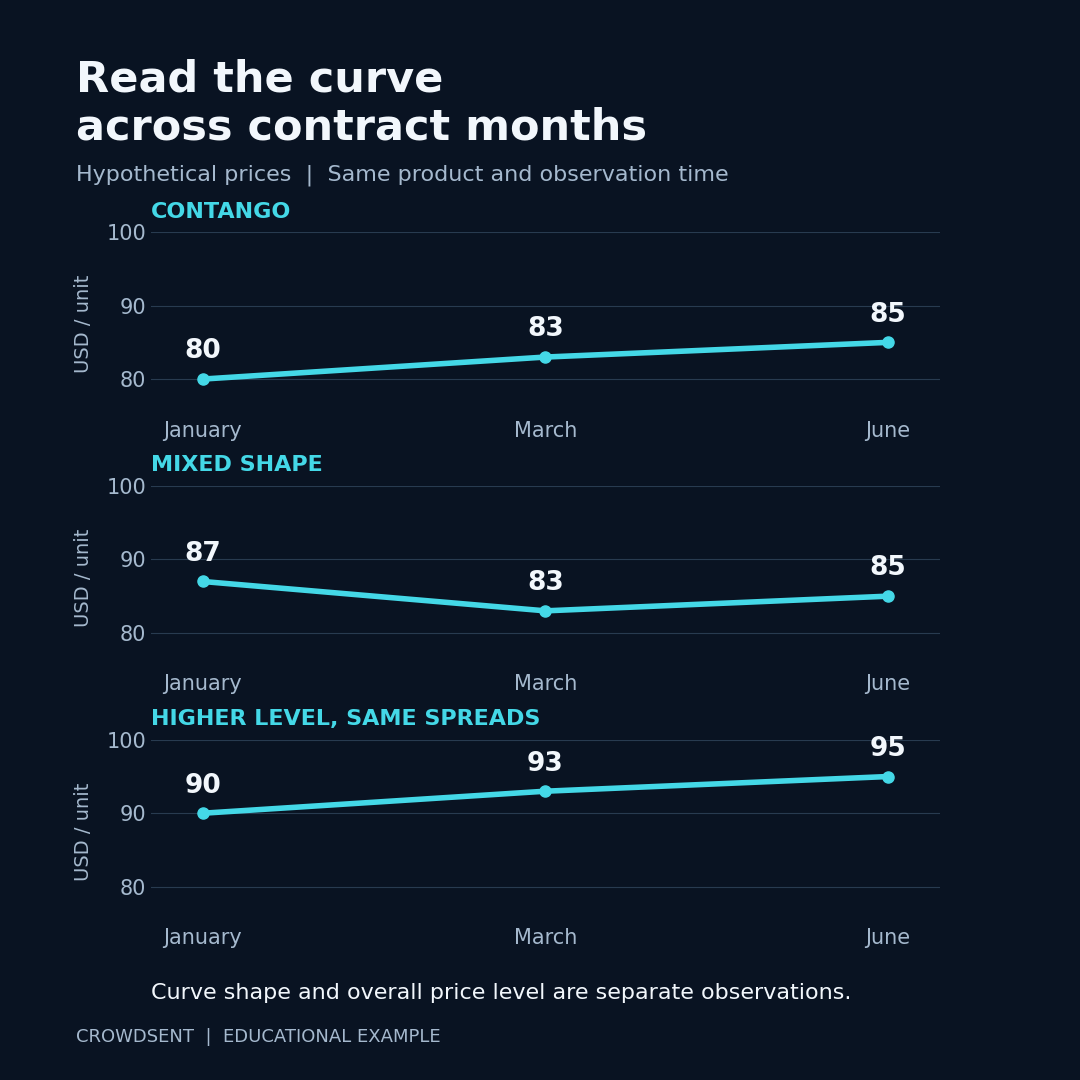
Hypothetical example: consider one fictional commodity futures product, quoted in dollars per unit. On the same day, the January contract settles at $80, March at $83 and June at $85. These are invented teaching values, not current market quotes.
Choose the convention “deferred price minus nearby price.” March minus January equals $83 − $80 = $3 per unit. June minus March equals $85 − $83 = $2 per unit. Both intervals show contango. The January-to-June difference is $5, although its time interval is longer.
Another screen might quote January minus March. Its value would be −$3 for exactly the same market. A negative spread is therefore not enough information to identify the curve’s shape without knowing the leg order.
Now change only January to $87. January is above March, so January-to-March is backwardated. March-to-June remains in contango. Calling the entire curve “backwardated” would conceal the bend.
CME’s calendar-spread and storage lesson explains how a spread compares two expiration months at the same observation time. A written calculation should always identify both legs, even when a chart uses a convenient abbreviation.
Separate the price level from the curve shape
Suppose January, March and June later settle at $90, $93 and $95. Every contract rose by $10, while the two adjacent differences stayed at $3 and $2. The whole curve moved higher without changing its shape in dollar terms.
Alternatively, January could remain $80 while March falls to $81 and June falls to $82. The curve remains in contango, but its dollar spreads narrow. “Prices rose” and “contango increased” describe distinct observations; either can occur without the other.
When comparing dates, preserve the actual contract months. A generic “front versus next” pair can refer to January and March on one date, then March and June after a roll. That changes the comparison even if no individual contract has moved.
Why carrying costs and seasonal conditions matter
Holding physical inventory can involve financing, storage and insurance. Those costs help explain why later delivery may command a higher price. Immediate access can also have value: inventory can keep a production line operating when replacement supply is uncertain. This benefit is often called convenience yield.
These are organizing concepts, not a universal formula that explains every curve. Storage constraints, expected supply, demand and seasonal patterns can create bends. A winter delivery month and a spring delivery month may face different underlying conditions.
CME’s discussion of energy term structure identifies storage dynamics, seasonality and supply-demand conditions as relevant variables. A useful research question is which contract interval changed and what conditions apply to that interval.
For example, a hypothetical December contract at $5, January at $6 and April at $4 has an upward first segment and a downward second segment. Averaging these into one slope would discard the specific winter premium that the numbers display.
What the curve does not establish
The curve is observed pricing today. It is not a promise that the nearby contract will rise to the deferred price, or that a later spot price must equal today’s futures quote. Prices and the curve itself can change as new information arrives.
A roll also needs careful language. Replacing a long near contract priced at $80 with a later one priced at $83 changes the contract held. The $3 quoted difference is not automatically a $3 cash fee paid as though purchasing physical inventory outright. Futures gains and losses depend on actual entry, exit and settlement prices, contract size and subsequent movements.
“Roll yield” is used in return decompositions, but a complete calculation must state its rules. A rolling index, a back-adjusted chart and a brokerage account can tell different numerical stories. Do not calculate an account return from the slope alone.
A repeatable curve-reading checklist
- Write the exact product and contract months.
- Record the observation time, currency and price field.
- State the spread convention before calculating.
- Describe each relevant segment, including any hump or seasonal bend.
- Compare the same maturities across dates, or disclose the changed pair.
- Keep observed shape separate from proposed explanations and future-price scenarios.
Save the underlying quotes in a market research journal. If a deferred quote is unavailable, leave that point missing; our missing market data guide explains why replacing it with zero creates a false signal.
Frequently asked questions
1. Can contango exist while futures prices are falling?
Yes. Contango concerns prices across maturities at one time. Every contract could fall between two observations while later contracts remain above nearby ones. Compare the cross-maturity spreads separately from each contract’s time-series change.
2. Does backwardation mean a market is certain to rise?
No. It identifies a current price relationship. A curve can remain backwardated while all its prices decline. Treat any proposed explanation, such as limited immediate supply, as something to investigate rather than a guaranteed future outcome.
3. Can one curve contain both shapes?
Yes. A near-to-next interval can be backwardated while more distant months are in contango. Name the contract pair or section instead of forcing one label onto the whole curve.
4. Why do two websites report opposite spread signs?
One may subtract nearby from deferred, while the other subtracts deferred from nearby. They may also use different months or timestamps. Reconstruct the two individual prices and the subtraction order before comparing the reported values.
5. Is a futures curve the same as a continuous chart?
No. A curve compares several maturities at one moment. A continuous chart links selected contracts across many observation dates. Its roll and adjustment methods affect the historical path it displays.
6. Must the front month be the most actively traded?
No. “Front” usually identifies the nearest relevant expiry, while activity can migrate to a later contract. Check volume and open interest by maturity rather than assuming the first listed contract is the most liquid.
7. Can I compare a spot quote from one location with any futures contract?
Only with explicit qualifications. Different grade, delivery point, currency or observation time can create a difference unrelated to maturity. A matched futures-to-futures comparison is often easier to define clearly.
8. Should I annualize a calendar spread?
Only if the question requires it and the method is stated. Annualization depends on the interval, denominator and convention. A simple dollar spread is often clearer for describing the observed curve without implying a realizable annual return.
9. Can a stale quote make the curve misleading?
Yes. If one contract’s price is older than another’s, the apparent slope may combine different market moments. Check the observation time and price field for every point, particularly when a distant maturity has little recent activity.
10. What should accompany a screenshot of a curve?
Include the product, observation date, contract labels, units and price source. State whether values are settlements or quotes, and describe the particular interval of interest. Those details make the picture reproducible when the market later changes.
Keep the research process consistent
To explore the workspace and its membership options, open CrowdSent.
Educational note: This article explains market concepts for research. It is not investment advice or a recommendation to trade. Futures involve leverage and can produce losses greater than the amount initially deposited.