

By CrowdSent Blog Team
A hypothetical value grows from INR 1,00,000 to INR 1,72,800 over exactly three years. Its cumulative increase is 72.8%, while its compound annual growth rate, or CAGR, is 20% a year. Dividing 72.8 by three produces a different number and does not reproduce the ending value through annual compounding.
CAGR is useful for summarising an observed start and finish on an annual scale. Its main limitation comes from that same simplicity: many different paths, including paths with losses, can connect those endpoints.
What compound annual growth rate measures
Compound annual growth rate is the constant annual rate that would turn a specified beginning value into a specified ending value over the elapsed period. It describes an equivalent steady pace. It does not say that the measured value actually grew at that pace every year.
The formula is CAGR = (ending value ÷ beginning value) raised to the power (1 ÷ years), minus one. Use a positive beginning value, a positive ending value and a positive elapsed duration for the standard case discussed here.
Microsoft’s CAGR explanation describes the measure as a smoothed annual compounding rate. The smoothing occurs in the summary, not in the original history. Keep the underlying yearly observations if the route matters to your research.
The same mathematics can describe a suitably defined revenue series, an index or an account with no external cash flows. What the result means depends on the object being measured. Revenue growth, price growth and an investment return are different descriptions even when their endpoint arithmetic is identical.
Calculate compound annual growth rate in the three-year example
Use a hypothetical starting value of INR 1,00,000 and an ending value of INR 1,72,800. The observations are exactly three years apart. Assume no external deposits or withdrawals, and maintain the same currency and value definition throughout.
- Find the total growth factor: 1,72,800 ÷ 1,00,000 = 1.728.
- Take its cube root because the elapsed period is three years: 1.728 raised to the power 1/3 = 1.20.
- Subtract one: 1.20 − 1 = 0.20.
- Express the decimal as a percentage: CAGR = 20% a year.
Verify by rebuilding the smooth path. After one year, 1,00,000 × 1.20 = 1,20,000. After two years, 1,20,000 × 1.20 = 1,44,000. After three, 1,44,000 × 1.20 = 1,72,800.
The cumulative return is still 1.728 − 1 = 72.8%. Its simple division by three is about 24.27% per year, but compounding 24.27% annually would overshoot the endpoint. CAGR solves for the repeated factor rather than distributing the total percentage equally by subtraction.
The formula is unchanged for a PKR series with the same proportional values. That observation concerns arithmetic only; it does not claim that INR and PKR purchasing power or currency exposure are equivalent.
Two histories can have the same CAGR
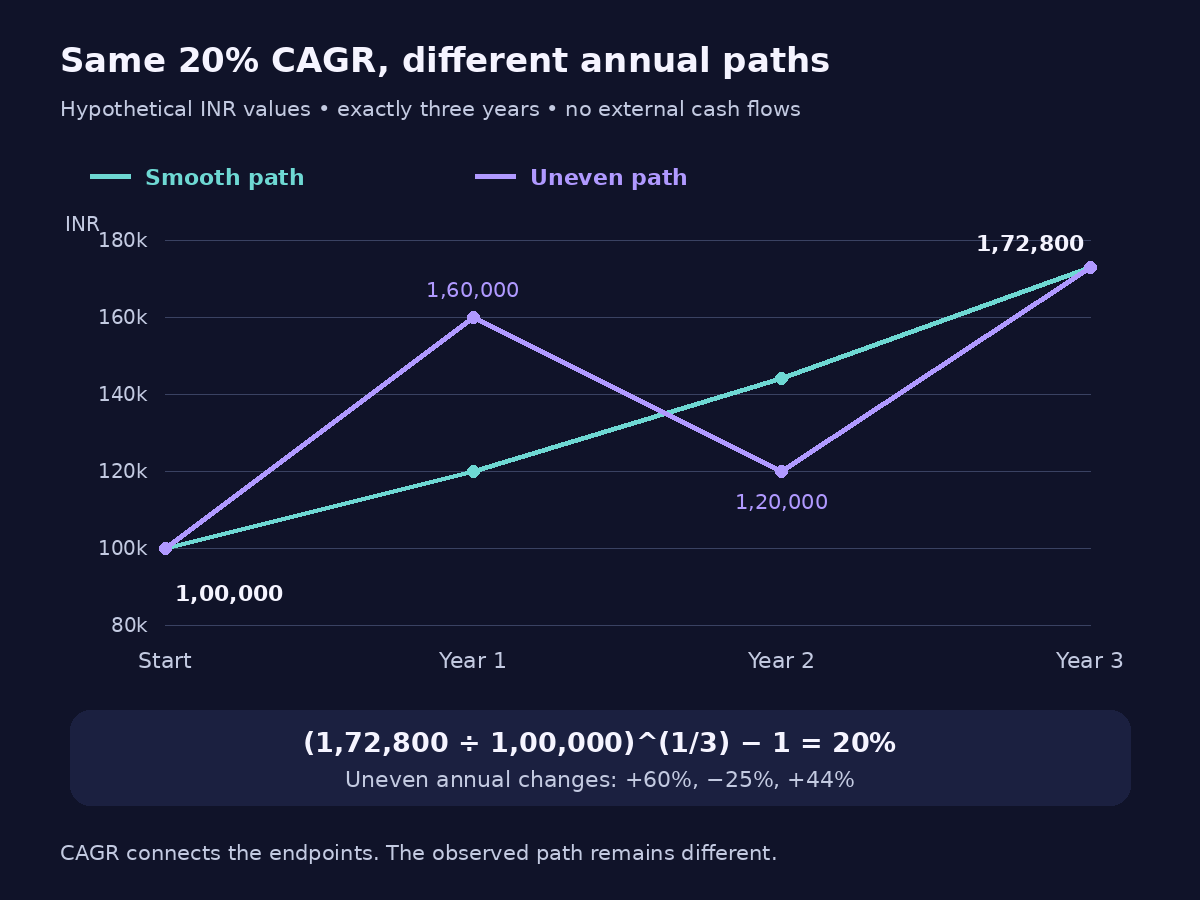
Compare the smooth example with a second hypothetical path: INR 1,00,000 at the start, INR 1,60,000 after Year 1, INR 1,20,000 after Year 2 and INR 1,72,800 after Year 3. Both histories begin and end at the same values on the same dates.
The second history’s annual simple changes are +60%, −25% and +44%. Multiply the factors to check: 1.60 × 0.75 × 1.44 = 1.728. Its CAGR is therefore also 20%, even though none of its three actual annual changes equals 20%.
The arithmetic average of those annual changes is (60 − 25 + 44) ÷ 3, or approximately 26.33%. That average describes the centre of the annual percentage observations. It does not describe the steady compounded rate that links the endpoints.
A single CAGR cannot reveal when the decline occurred, how far the series fell between observations or how long it took to recover. Those questions require the path and an appropriate observation frequency. The summary should sit beside those records rather than replacing them.
In a caption, write “three-year CAGR of 20%; annual changes of +60%, −25% and +44%.” That wording makes both the endpoint summary and the uneven sequence visible without implying a forecast.
Count elapsed years rather than row labels
Four annual observations normally contain three one-year intervals. A table headed Start, Year 1, Year 2 and Year 3 does not cover four years merely because it has four rows. In the worked example, using four in the exponent would understate the equivalent annual pace.
Use actual observation dates when the period is not a whole number of years. Exactly 18 months corresponds to 1.5 years under a month-based convention. A growth factor of 1.21 over that duration gives 1.21 raised to the power 1/1.5, minus one, or approximately 13.55% annually.
For day-level dates, state the day-count convention rather than silently switching between calendar anniversaries and days divided by a fixed year length. Small differences can matter when reproducing a provider’s calculation.
Fiscal-year labels need attention too. “FY2022 to FY2025” may refer to annual totals, year-end values or a reporting label attached to a shorter period. Confirm the endpoints before assigning the number of elapsed years. A first partial fiscal year is especially easy to mistake for a full one.
A larger balance may include money added from outside
Imagine a fictional account begins with 1,00,000 and earns no return for three years. Immediately before the ending observation, another 50,000 is deposited. The closing balance is now 1,50,000.
Applying the endpoint CAGR formula blindly gives 1.5 raised to the power 1/3, minus one, approximately 14.47% a year. That is growth in the recorded balance, largely driven by the deposit. It would be incorrect to present it as the account’s investment performance.
External cash flows require a method that fits the question and includes their amounts and timing. The GIPS Standards Handbook for Firms explains time-weighted and money-weighted performance concepts. This article does not treat a raw balance CAGR as a substitute for either.
The same boundary appears in business data. A revenue series that changes because a new business was acquired may still have a calculable CAGR, but the number alone does not isolate growth within the original operations. Preserve any scope changes next to the result instead of assigning them a cause the endpoints cannot establish.
Use matching definitions before comparing two CAGRs
Specify whether the inputs include distributions and whether they are nominal or inflation-adjusted. A price-only CAGR and a dividend-inclusive CAGR summarise different value histories. A nominal currency series and a real purchasing-power series also answer different questions.
Currency conversion can change the endpoints and the resulting annual rate. To compare in one currency, use a consistent conversion rule and preserve the quotation direction. CrowdSent’s guide to base and quote currencies helps make the units explicit.
Match the period as well. A one-year result ending during an unusual episode and a ten-year result ending at the same time use different histories. The word “annual” in both labels does not make their observation windows equivalent.
For a useful comparison record, list beginning date, ending date, beginning value, ending value, years, currency, distribution treatment and cash-flow handling. The guide to reading historical data in context offers related checks on windows and changing coverage. A precise rate attached to an imprecise series remains difficult to interpret.
Recognise where the summary stops being useful
A positive CAGR does not imply a smooth experience or a guaranteed future pace. It reports the annual equivalent of an observed or otherwise specified endpoint relationship. Extending the smooth example into future years would be a new assumption that needs to be labelled separately.
A negative CAGR is valid when both endpoints are positive and the ending value is lower. For example, 100 falling to 81 over two years gives a CAGR of −10%, because 100 × 0.90 × 0.90 = 81.
A zero beginning value makes the standard ratio undefined. Negative starting or ending values, such as a business moving from a loss to a profit, do not support the ordinary positive-base CAGR interpretation. Show the actual amounts and appropriate period changes instead of forcing a familiar percentage.
Finally, distinguish observed annual results from annualising a short fragment. A short-period extrapolation can look impressive without containing a full year’s evidence. Preserve the original period and any reporting convention. Record those choices in the market research journal template so that the annual label cannot outgrow the evidence behind it.
Frequently asked questions
What does CAGR stand for?
CAGR stands for compound annual growth rate. It is the constant annual compounding rate that connects a specified beginning value and ending value over a stated number of years, under a consistent measurement basis.
What is the CAGR formula?
Divide the ending value by the beginning value, raise the ratio to the power one divided by elapsed years, and subtract one. Multiply by 100 to express the answer as a percentage. Check that the inputs satisfy the formula’s assumptions.
Why can’t I divide total growth by the number of years?
That division ignores annual compounding. In our example, a 72.8% cumulative increase over three years corresponds to 20% compounded annually, not 24.27%. Rebuild the ending value from the annual factor to check the result.
Does a 20% CAGR mean every year gained 20%?
No. It means 20% is the steady annual rate equivalent to the overall endpoint change. The worked uneven history has annual changes of +60%, −25% and +44%, yet it shares the same three-year CAGR.
How many years do four annual price observations cover?
If the observations are consecutive annual endpoints, they span three one-year intervals. Count the elapsed intervals or use the actual dates. The number of rows is not the duration used in the exponent.
Can CAGR be negative?
Yes, with suitable positive endpoints. A value declining from 100 to 81 over two years has a CAGR of −10%. Negative CAGR describes the endpoint contraction; it does not require the series to have fallen by that amount every year.
Can CAGR measure a portfolio with regular deposits?
A CAGR of raw balances mixes performance with money added or withdrawn. To measure performance, use a method that accounts for the cash flows and their timing. The balance-growth percentage alone cannot separate those effects.
Is CAGR the same as the arithmetic average return?
Generally, no. An arithmetic average adds the observed interval returns and divides by their count. CAGR finds the annual compounded rate linking the endpoints. They coincide in a constant-return example but need not match an uneven history.
Should I compare CAGRs over different periods?
Only with the different periods clearly stated and a reason for the comparison. Annualisation gives a common reporting unit, but the underlying histories remain different. Matching dates and definitions usually makes the interpretation easier to evaluate.
Can I use a past CAGR as a forecast?
A past CAGR is a description of the selected history. Repeating it into the future adds an assumption that the calculation does not establish. Keep historical measurement and any separately labelled scenario distinct, and do not describe the historical rate as assured.
Educational information only. All worked numbers are hypothetical unless identified as a source definition. This article provides no forecast, recommendation or investment advice.