

By CrowdSent Blog Team
Average true range (ATR) describes the size of recent price ranges, including movement between the previous close and the current bar. An ATR reading of 2.40 means 2.40 price units under the selected calculation. It does not mean a 2.40% return, a maximum possible loss, or a forecast that the next bar will move that distance.
The useful question is specific: how much range has this instrument recently displayed, on these bars, with this smoothing method? Once those inputs are clear, ATR becomes easier to compare and harder to overinterpret. This guide follows one calculation from raw prices to a finished reading, then places it beside other indicator families.
Educational information only; examples are hypothetical and do not recommend a transaction.
What does average true range measure?
Start with a bar’s high and low. Subtracting the low from the high gives its ordinary range. However, that interval can miss a gap from the preceding close. A market might close at 100, reopen above 105, and trade within a narrow band for the rest of the session. Measuring only that session’s high minus low would leave out much of the change from the previous close.
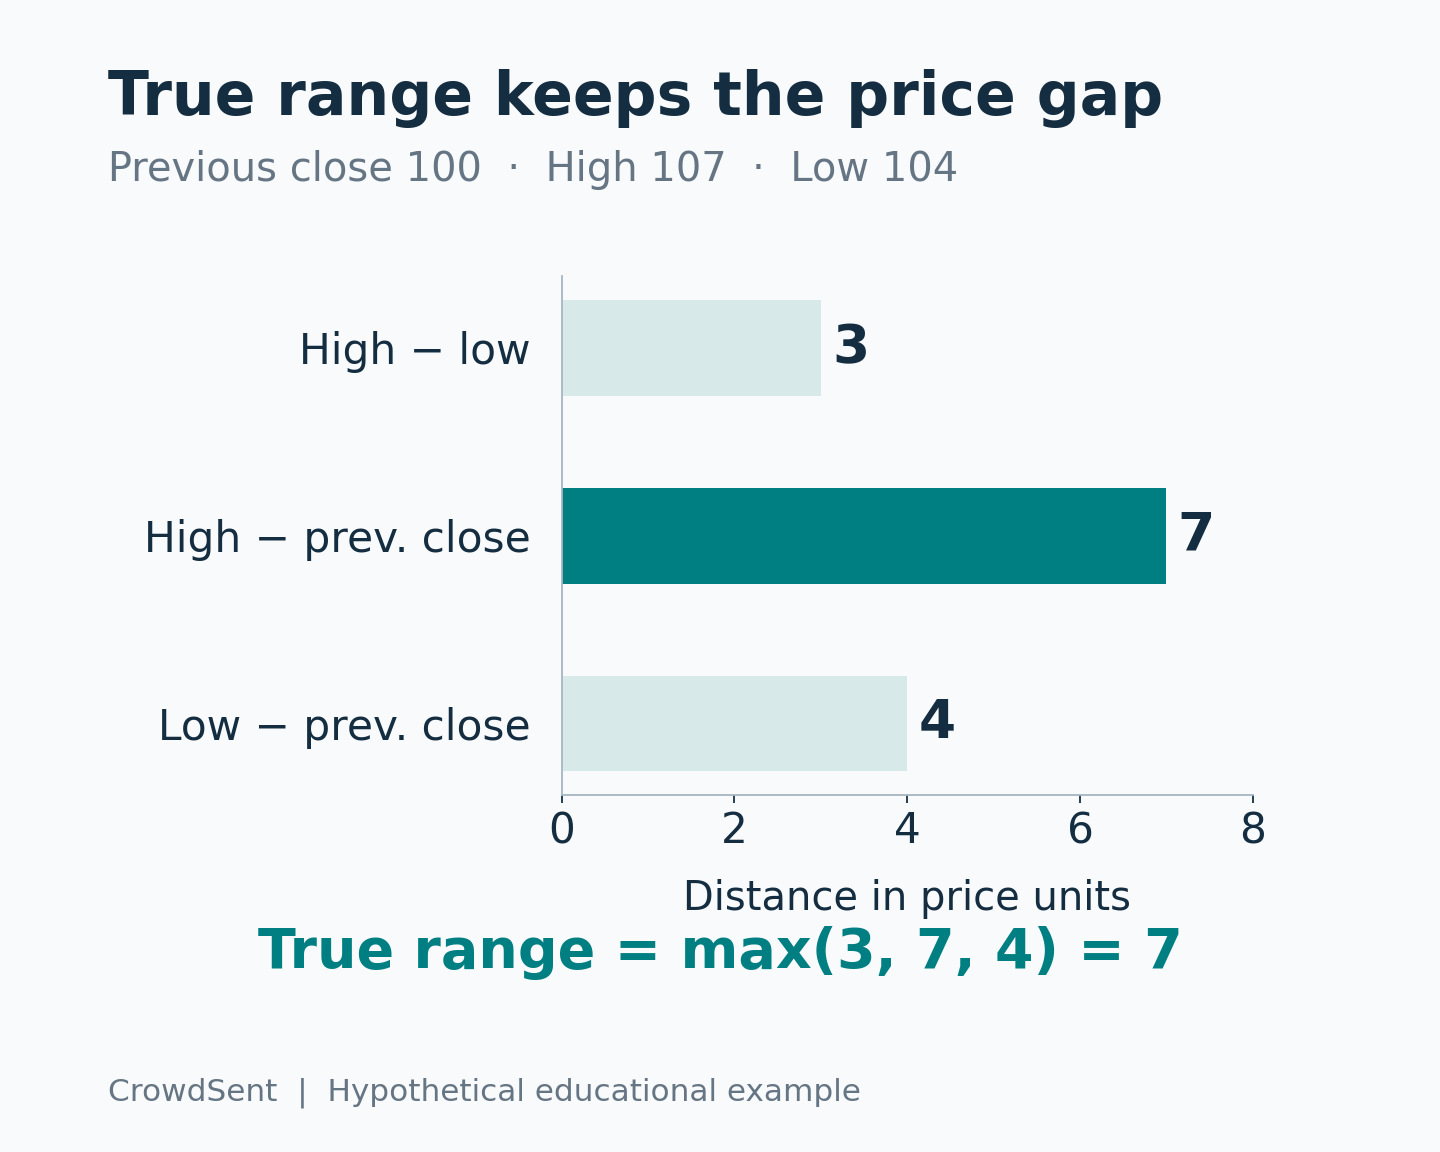
True range addresses this by taking the largest of three distances: current high minus current low, the absolute difference between current high and previous close, and the absolute difference between current low and previous close. The absolute differences remove the sign. ATR smooths successive true ranges. Fidelity’s ATR reference documents these inputs and the recursive smoothing formula used below.
A gap makes the difference visible
Suppose yesterday’s close was 100. Today’s high is 107, low is 104, and close is 106. The intrabar range is 107 − 104 = 3. The high-to-previous-close distance is |107 − 100| = 7. The low-to-previous-close distance is |104 − 100| = 4. True range is therefore 7, the largest candidate.
Notice that today’s close of 106 does not enter this bar’s true-range calculation. It becomes the previous-close input for the next bar. Also notice that the opening price is not a direct formula input. Its effect can be reflected in the high and low relative to the previous close.
Reverse the gap and the logic still works. With previous close 100, high 96 and low 93, the three candidates are 3, 4 and 7. True range remains 7. That symmetry explains why the number cannot tell you whether the gap was upward or downward.
How is ATR calculated from true range?
For a Wilder-style ATR with length n, a common initialization is the arithmetic mean of the first n valid true ranges. Each subsequent reading is calculated as: new ATR = ((n − 1) × previous ATR + current true range) ÷ n. The previous average retains weight, so this is not simply a fresh arithmetic mean of the last n ranges on every bar.
Use a deliberately short three-bar example to make the arithmetic inspectable. The initial true ranges are 2, 3 and 4. Their average is (2 + 3 + 4) ÷ 3 = 3. When the next true range is the gap-day value of 7, ATR becomes ((2 × 3) + 7) ÷ 3 = 4.3333. If the next true range is 2, the new reading is ((2 × 4.3333) + 2) ÷ 3, approximately 3.5556.
The large range influences more than one reading. It is progressively diluted rather than removed in a single step after exactly three new bars. Keep full precision during the calculation and round the final displayed value. Repeatedly feeding rounded display values back into a worksheet can create avoidable discrepancies.
Why the averaging method matters
A three-bar simple average using the latest values 3, 4 and 7 would equal 4.6667, whereas the Wilder-style update just calculated equals 4.3333. Both are mathematically coherent summaries. They answer slightly different weighting questions.
TradingView’s ATR documentation says its default uses a relative moving average and allows other smoothing choices. Therefore, two panels labeled ATR(14) are not necessarily comparable until their smoothing settings match. The platform name alone is insufficient, because users can change defaults or add custom indicators.
Fourteen is a common length, not a quality guarantee. On an hourly chart, fourteen refers to fourteen hourly bars. On a daily chart, it refers to fourteen daily bars. The recursive calculation also carries information from earlier observations through its previous average. Calling either setting simply a “14-day indicator” can misdescribe the input.
How should you compare ATR readings?
The first check is the price unit. A reading for a currency pair may be expressed in quote-currency units, while a stock reading uses that stock’s quotation currency and an index reading uses index points. The decimal display is not a universal risk scale. CrowdSent’s guide to pips, lots and contract size explains why unit conversions must come before any monetary interpretation.
Consider instrument A at a closing price of 50 with ATR 1, and instrument B at 500 with ATR 5. B has the larger absolute ATR. Dividing each reading by its own close produces 2% for A and 1% for B. Under this normalization, A has the larger range relative to price. The comparison reverses because the question changed.
State the normalization explicitly: ATR percentage = 100 × ATR ÷ current close. The denominator matters, and the ratio is not an annualized standard deviation of returns. Fidelity’s glossary entry for ATRP describes normalization by a bar’s closing price.
Changing quotation units leaves the percentage unchanged
Consider the same hypothetical price history expressed in two different units. In the original unit, the latest close is 50 and ATR is 1. Now multiply every high, low and close in the history by ten, and scale the starting ATR consistently. The latest close becomes 500 and ATR becomes 10.
Each true-range candidate is ten times larger, and the weighted averaging calculation preserves that scaling. Yet normalized ATR is unchanged: 100 × 1 ÷ 50 = 2%, and 100 × 10 ÷ 500 = 2%. The larger raw reading reflects a unit conversion, not a change in the underlying observations.
This check works only when the entire input series and initialization use the same conversion. Scaling the current close while leaving historical ranges untouched would create an inconsistent ratio. Comparing separate instruments also introduces differences beyond units, so matching percentage readings alone cannot establish equivalent risk or trading conditions.
Keep the observation window consistent
Matching length alone does not match the sample. Compare the same bar duration, trading session, data source, instrument definition and last completed bar. A daily series that includes an extended session can contain highs and lows absent from a regular-session series. Different session boundaries can allocate the same transaction to different bars.
For example, an intraday observation at 10:15 cannot be treated as the final high or low of a bar ending at 11:00. If that bar later widens, its true range and current ATR may change. Save the timestamp and whether the bar was complete when recording a reading.
Missing bars also need attention. A zero entered in place of a missing price can create an enormous artificial range. Silently skipping observations can change what the lookback covers. Use the checks in missing market data versus zero before deciding that an unusual ATR is a market event.
Where ATR fits among other indicators
Indicators can share a chart while summarizing different aspects of its data. A compact map helps prevent a common mistake: treating five transformed price series as five independent pieces of evidence.
- ATR summarizes high-low and previous-close distances in price units.
- Bollinger Bands place a dispersion-based envelope around a moving average.
- ADX summarizes the separation of directional-movement measures after smoothing.
- The stochastic oscillator locates a close within a recent high-low interval.
- On balance volume cumulatively adds or subtracts reported volume according to close-to-close direction.
The map is a classification aid, not a proposed trading system. If an ATR line rises while a momentum oscillator falls, the displays may be fully consistent: recent ranges widened while closes moved toward the lower part of their reference interval. “Disagreement” only becomes meaningful after stating which property each measure was supposed to describe.
Similarly, a quiet ATR reading cannot establish that a company is financially sound, that an exchange is reliable, or that an instrument can be sold in the desired quantity. Those questions require evidence outside the range calculation.
Write a reading someone else can reproduce
A useful research note might say: “Hypothetical instrument X; daily completed bars; source Y; Wilder-style ATR length 14; current ATR 2.40 quote units; close 120; normalized ratio 2.00%; data adjustment policy recorded.” This states the measurement and leaves its interpretation open to inspection.
Contrast that with “volatility is high.” High relative to what: yesterday, the preceding year, another instrument, or a personal expectation? Specify the reference period before attaching a label. CrowdSent’s market research journal guide provides a place to keep the source, settings and question together.
Frequently asked questions about average true range
1. Can ATR be negative?
With valid prices and standard nonnegative averaging weights, true range and ATR are nonnegative. A negative displayed value suggests a different calculation, bad inputs or a labeling issue. Zero is possible when all relevant distances are zero; it does not describe every aspect of market risk.
2. Does a higher ATR mean price is rising?
No directional sign is retained in true range. The upward-gap and downward-gap examples both produced 7. To describe direction, inspect price changes or an explicitly directional measure separately, using the same dates and bar definition.
3. Is ATR the average daily return?
No. Daily return compares closing values, usually as a percentage or logarithmic change. ATR combines ranges and previous-close distances, then smooths them. Two days with the same close-to-close return can have very different highs, lows and true ranges.
4. Why does my spreadsheet disagree with my chart?
Check smoothing, initial seed, available history, session boundaries, adjusted prices, missing values and rounding. Compare individual true ranges first. If those agree but the averages differ, the problem is likely in initialization or smoothing rather than the high-low arithmetic.
5. Is ATR(14) based only on the latest fourteen bars?
A simple-average version uses a fixed fourteen-bar window. A Wilder-style recursive version gives older information diminishing influence through the previous ATR. The label needs its averaging method before you can make a precise statement about historical weighting.
6. Can ATR predict tomorrow’s maximum range?
It summarizes observed ranges; it does not impose a ceiling on future movement. Tomorrow’s true range can exceed today’s ATR by a large amount. Treating a historical average as a maximum confuses a descriptive calculation with a boundary that the formula never establishes.
7. Is percentage ATR comparable across all assets?
Normalization removes one price-scale difference, but session length, trading hours, data quality and instrument structure can still differ. Match those definitions first. The ratio can also become unstable when its price denominator approaches zero, requiring particular care with unusual price series.
8. Does ATR include an overnight gap?
It includes the distance from the previous close to the current high or low when that distance is the largest candidate. Exactly which interval counts as overnight depends on the session and bar definitions in the data you selected.
9. Can an adjustment in historical prices change ATR?
Yes. Revisions to any high, low or previous close can change true range and subsequent smoothed readings. A worksheet should use a consistent adjustment policy across all inputs. Combining adjusted closes with incompatible unadjusted highs and lows can manufacture a misleading gap.
10. What should I record alongside an ATR screenshot?
Record the instrument, data source, bar interval, session, length, smoothing method, price units and observation timestamp. Include whether the last bar was complete. A screenshot without these details may preserve the appearance of a result while losing the information needed to reproduce it.
Conclusion: keep the range, unit and method together
Average true range becomes useful when its construction stays visible. First verify the three true-range distances, then identify the averaging method and seed, and finally compare readings on consistent data. A higher line describes a larger smoothed range under those choices. Any claim about direction, future losses or execution needs additional evidence.
Source documentation checked 11 October 2026. Educational explanation from the CrowdSent Blog Team. Numerical examples are hypothetical unless explicitly identified otherwise. This article does not provide investment recommendations.