

By CrowdSent Blog Team
The average directional index (ADX) summarizes how strongly two smoothed directional-movement measures differ. It is normally read as a trend-strength measure. Its value does not contain the sign of the price direction: an upward trend and a downward trend can produce the same ADX.
The easiest way to understand the indicator is to follow its ingredients. Highs and lows produce directional movement, true range provides a normalization base, the positive and negative directional indicators become +DI and −DI, and their relative separation becomes DX. Smoothing DX produces ADX. Each stage answers a narrower question than a claim about where the market will go next.
All numerical examples are hypothetical and are intended to explain calculations, not recommend transactions.
How does the average directional index relate to +DI and −DI?
A directional-movement panel commonly contains three lines. The +DI line represents positive directional movement relative to smoothed true range. The −DI line represents negative directional movement on the same basis. ADX is a smoothed summary of their relative difference, using an absolute value that removes which line is higher.
This distinction matters when reading captions. “ADX rose” describes the strength measure. “+DI exceeded −DI” describes the ordering of the directional lines. “The closing price rose” is a third statement about the observed price. A useful note keeps all three statements separate.
Fidelity’s explanation of ADX distinguishes trend strength from the direction indicated by the two DMI lines. Its discussion of commonly watched levels is a description of chart-reading conventions, not a probability guarantee.
How highs and lows become directional movement
For the conventional Wilder construction used here, first calculate UpMove = current high − previous high. Then calculate DownMove = previous low − current low. Keep positive directional movement only when UpMove is positive and greater than DownMove. Keep negative directional movement only when DownMove is positive and greater than UpMove. Otherwise the respective value is zero.
This is a selection rule, not an instruction to add every extension on both sides of the bar. If the positive candidates tie, neither side wins and both directional-movement values are zero under this convention. An inside bar also produces zero directional movement because neither extreme extends beyond the previous bar.
Three small bar comparisons
Suppose a previous bar has high 105 and low 100. A new bar with high 108 and low 101 gives UpMove 3 and DownMove −1. Positive directional movement is 3 and negative directional movement is zero.
Next consider a new bar with high 108 and low 98, compared with the same previous bar. UpMove is 3 and DownMove is 2. Both extremes extended, but the upward extension was larger, so +DM is 3 and −DM is zero. If the new low had instead been 97, the candidates would both equal 3 and both selected values would be zero.
The current close is not used to choose those directional extensions. The previous close enters the true-range calculation that supplies the normalization base. A bar can close down while its high-low comparison produces positive directional movement. This is one reason the word “directional” should not be interpreted as a simple label for the latest closing return.
StockCharts’ ADX calculation reference documents the winner-selection rule and the smoothing sequence. Its construction is the convention followed in the examples here.
A worked example from smoothed inputs to ADX
After calculating +DM, −DM and true range for successive bars, smooth all three consistently. The following hypothetical snapshot starts after that stage, so the numbers are explicit assumed inputs rather than an implied full price-history reconstruction.
Assume a smoothed true-range sum of 30, a smoothed positive-directional-movement sum of 9, and a smoothed negative-directional-movement sum of 3. Then +DI = 100 × 9 ÷ 30 = 30. Likewise, −DI = 100 × 3 ÷ 30 = 10.
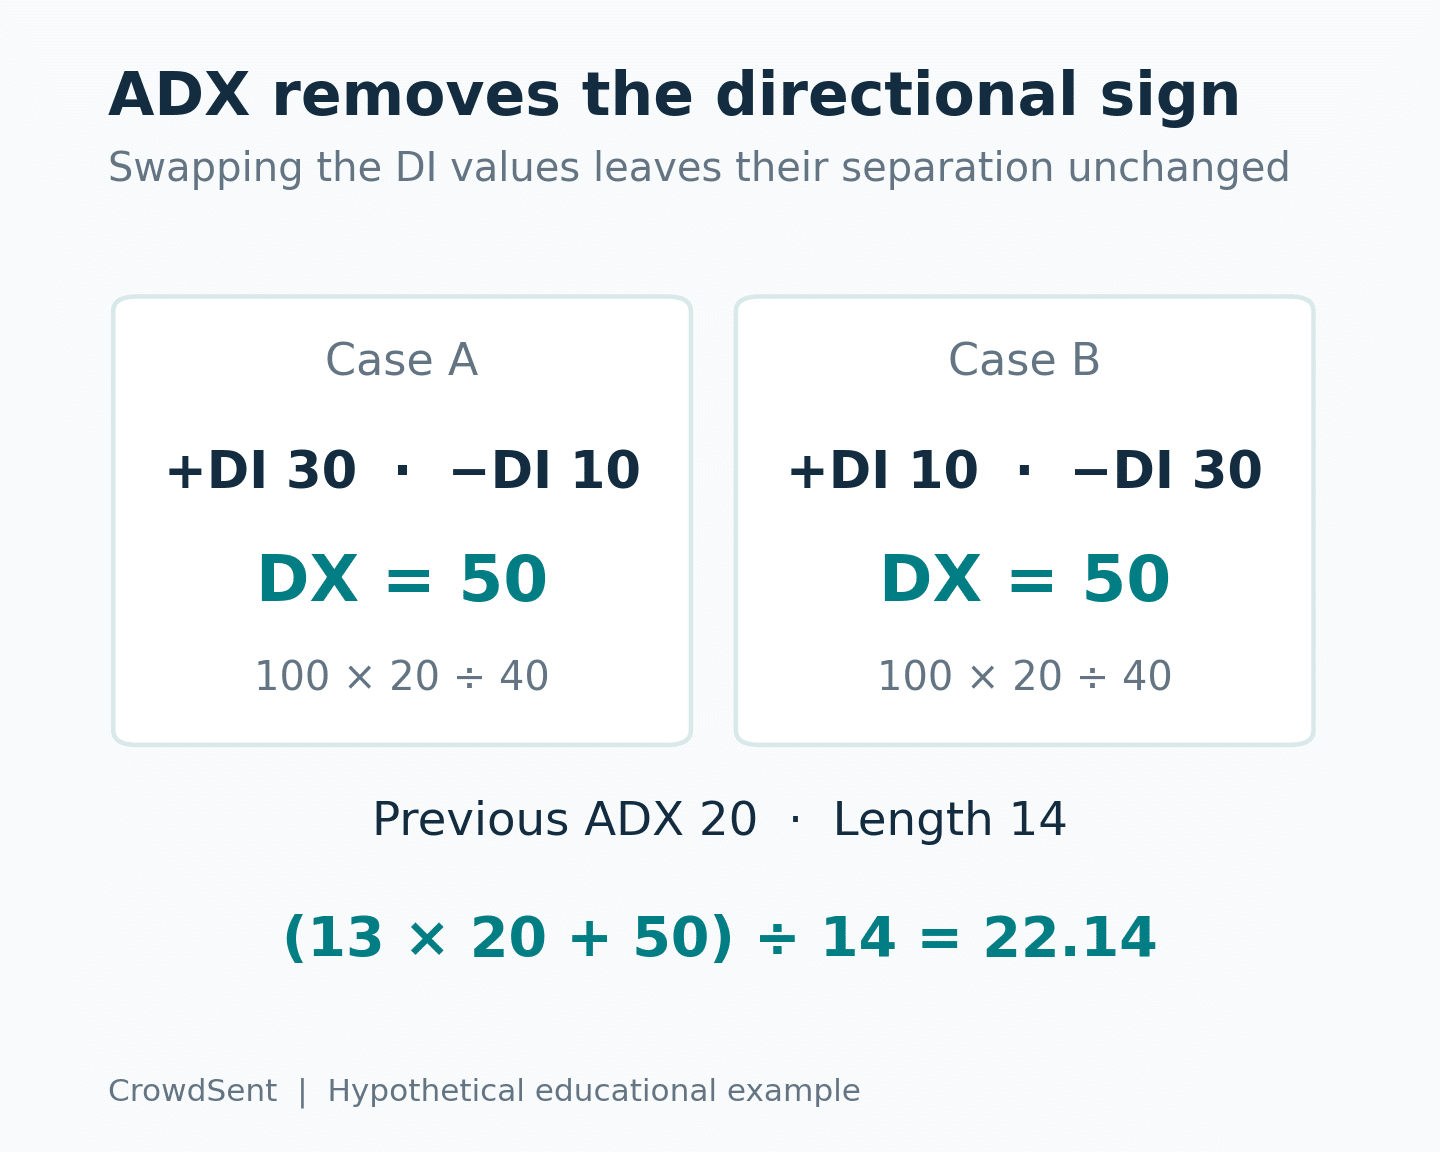
DX measures the relative difference: DX = 100 × |+DI − −DI| ÷ (+DI + −DI). With the assumed values, DX = 100 × |30 − 10| ÷ (30 + 10) = 50.
For a fourteen-period Wilder-style update, suppose the previous ADX is 20. The new value is ((13 × 20) + 50) ÷ 14 = 22.1429, rounded. The current DX was 50, but the smoothed ADX is only about 22.14 because prior observations still influence the average.
Swap the directional lines
Now reverse the assumed directional sums: positive 3 and negative 9, leaving true range at 30. The directional lines become +DI 10 and −DI 30. DX is still 100 × |10 − 30| ÷ 40 = 50, and the same previous ADX of 20 again updates to about 22.14.
This controlled example shows exactly where directional information disappears. The absolute difference is identical after swapping the lines. An ADX reading alone cannot distinguish those two cases, even though their directional ordering is opposite.
Use either sums or averages consistently
If every smoothed sum is divided by fourteen, the directional ratios remain unchanged: (9 ÷ 14) ÷ (30 ÷ 14) still equals 9 ÷ 30. That is why consistent smoothed sums and consistent smoothed averages can produce the same DI readings.
A worksheet error occurs when only one side is rescaled. Dividing a smoothed directional sum by an average true range mixes units and inflates the ratio. Label intermediate columns clearly and compare like with like before judging the final result.
What does a rising or falling ADX mean?
Under the stated recursive update, ADX rises when current DX exceeds previous ADX and falls when current DX is lower. This arithmetic description is more precise than assuming every upward tick means the latest price bar extended a trend.
For example, keep previous ADX at 20 but change current DX to 5. The update becomes ((13 × 20) + 5) ÷ 14 = 18.9286. The strength measure falls. That calculation does not require a downward price move. It requires current DX to be below the previous ADX; DX can even rise from its own previous reading while ADX falls.
The level and the change are also different. A move from 40 to 38 is falling but still numerically above a move from 15 to 18. Describing both the level and recent slope is more informative than calling one reading simply strong or weak.
Treat thresholds as conventions
Levels around 20 and 25 often appear in introductory ADX explanations. They can serve as reference labels within a specified method. They are not universal boundaries that certify whether every asset is trending, and they do not represent a percentage probability of a successful trade.
A reading of 25 on hourly bars and a reading of 25 on daily bars describe different underlying histories. Comparing them as though they were two measurements of the same interval loses information. Likewise, a tiny move across a threshold may reflect rounding, an unfinished bar or a data revision.
Why two ADX panels may disagree
Smoothing is a material input. Schwab’s thinkorswim DMI documentation states that Wilder’s averaging is the default while other average types are selectable. A changed average type can alter both the directional lines and the final strength measure.
Names also need checking. MetaQuotes documents a distinct ADX Wilder function alongside its ADX function. Do not assume similarly named indicators are interchangeable. Record the exact study or function and its inputs when reconciling results.
Initialization adds another difference. The first smoothed directional values and the first ADX need starting conventions. Recursive updates retain decreasing influence from those starting values, so exporting only a short recent slice may not reproduce a chart calculated with a longer history.
Before examining implementation, compare the underlying highs, lows and closes. A missing value replaced with zero can disrupt both directional movement and true range. CrowdSent’s guide to missing market data explains why a blank observation needs different handling from a genuine zero.
What belongs in an ADX research note?
Include the exact instrument, venue, source, bar duration, session, completed-bar timestamp, directional length, ADX smoothing length where separately configurable, averaging method and available warm-up history. Then record ADX, +DI and −DI together.
For example: “Hypothetical completed daily bar; +DI 30, −DI 10, DX 50; previous ADX 20; fourteen-period Wilder-style update gives 22.14.” This is an inspectable calculation statement. It does not infer a participant’s intentions or the cause of a move.
If a discussion claims an ADX reading confirms what investors believe, ask for separate evidence about those investors. Price-derived directional movement and expressed sentiment are different inputs. CrowdSent’s explanation of what a sentiment score means helps keep the measures distinct. Save both definitions in a research journal before comparing them.
Frequently asked questions about ADX
1. Does a rising average directional index mean price will rise?
No. The absolute difference used in DX removes the directional sign. The worked example produced identical ADX updates with the directional lines reversed. Read the line ordering and price history separately, and do not treat either as a guarantee of future movement.
2. Is ADX the same as +DI?
No. +DI is one directional component normalized by smoothed true range. ADX is obtained later, after comparing +DI with −DI and smoothing their relative separation. A panel can show all three, but they have different meanings and should be labeled individually.
3. Why can ADX stay elevated after price changes direction?
Its inputs are smoothed, and then DX is smoothed again. Earlier directional separation therefore continues to influence the result. A sudden price reversal does not erase that history immediately, so the current level must be interpreted with its calculation path.
4. What is the difference between DX and ADX?
DX is the current normalized absolute difference between the directional lines. ADX smooths a sequence of DX values. In the example, DX was 50 while the updated ADX was about 22.14, illustrating why the labels cannot be exchanged.
5. Is an ADX reading of 25 a 25% probability?
No. It is an indicator value constructed from directional ratios and smoothing. The calculation does not estimate the probability of a gain, a trend continuing or any other future outcome. Turning the scale into a probability requires a separate validated model.
6. What happens when upward and downward extensions tie?
Under the conventional Wilder selection rule described here, neither positive candidate is greater, so both selected directional movements are zero. A custom implementation may make other choices. Documenting the tie rule matters when recreating values on a small dataset.
7. Can ADX be calculated from closing prices alone?
Not using this conventional construction. Directional movement needs consecutive highs and lows, and true range also needs the previous close. A close-only approximation would be a different measure and should not be presented as an exact reconstruction.
8. Why do I need history before my analysis start date?
Recursive smoothing requires an initial state. Earlier bars establish that state before the interval you want to study. Starting from an arbitrary value on the analysis date can create differences that persist into later observations even when subsequent prices match.
9. What if both directional indicators equal zero?
The ordinary DX expression then has a zero denominator. Software needs an explicit convention for that case. Do not silently divide by zero in a worksheet; inspect the platform’s behavior and record whether it returns zero, missing data or another defined result.
10. Does ADX measure the size of possible losses?
No. It is a normalized directional-strength calculation. It does not include your position size, execution price, leverage or future price path. Even a well-reconciled ADX value cannot establish a maximum loss or the suitability of an instrument.
Conclusion: retain the directional components
The average directional index is easiest to read when its construction remains visible. Check the bar comparisons, normalize with consistent smoothed inputs, distinguish current DX from smoothed ADX, and keep +DI and −DI beside the final reading. This preserves what the calculation actually says without assigning a forecast to a number that has discarded direction.
Source documentation checked 11 October 2026. Educational explanation from the CrowdSent Blog Team. Numerical examples are hypothetical unless explicitly identified otherwise. This article does not provide investment recommendations.