

By CrowdSent Blog Team
WTI vs Brent is a comparison between two crude-oil benchmarks with different physical foundations and contract conventions. Both help people discuss oil prices, but a quote becomes meaningful only after you identify the benchmark, the instrument, the delivery period and the timestamp.
That distinction matters when one headline says oil is rising while another shows a smaller move. The difference may reflect genuinely different market conditions. It may also come from comparing different contracts or observation times. This guide provides the starting map for reading energy-market data, before moving into inventories, refinery activity and product margins.
What are WTI and Brent measuring?
A benchmark is a reference around which other prices can be organized. A physical cargo can be priced relative to a benchmark with a premium or discount reflecting its characteristics and delivery terms. It follows that a benchmark price is not the invoice price of every barrel sold worldwide.
WTI stands for West Texas Intermediate. The familiar U.S. benchmark is associated with light, relatively low-sulfur crude and the Cushing, Oklahoma, trading hub. Brent developed around North Sea crude and has a broad role in international oil pricing. The EIA’s explanation of crude benchmarks describes how quality, transport and regional conditions contribute to price differences.
Read these names as the beginning of a label. “WTI” could appear beside a physical spot assessment, a dated futures contract or a provider’s continuous chart. “Brent” can similarly refer to different parts of its pricing system. Two labels that look identical on a small screen may conceal different measurement choices.
The differences that matter when comparing prices
Physical location and access to transport
A barrel’s location changes the practical routes available to its owner. Moving oil requires infrastructure, time and money. For that reason, a comparison should ask where the oil is priced and what delivery obligations sit behind the quote. A disruption to one route does not need to affect every benchmark equally.
For research purposes, separate a general oil-market story from a location-specific explanation. “Global demand expectations changed” and “a local storage or transport constraint changed” are different hypotheses. A price spread can help identify the question, but it cannot tell you which explanation is correct by itself.
Crude quality and the benchmark’s definition
Light and heavy refer to density; sweet and sour refer to sulfur characteristics. Those descriptions help explain why crude streams are not perfect substitutes. They should not be used as a shortcut to claim that the higher-quality label must always command the higher observed price. Delivery terms and market conditions still matter.
The Brent system also evolves. EIA notes that most Brent price assessments incorporated WTI Midland into their basket in 2023. That makes “Brent is only North Sea oil” an incomplete modern description. Its discussion of Brent spot and futures prices also distinguishes Dated Brent from the exchange-traded futures contract.
The useful habit is to save the methodology that applied to your observation period. A long historical chart may span changes in the underlying reference. The name alone does not establish that its construction stayed identical throughout the series.
The exchange contract and settlement rules
A benchmark and a derivative referring to it are related concepts. They are not sufficient descriptions of each other. The CME WTI product page identifies physical settlement for its main NYMEX WTI contract. The ICE Brent specification describes a deliverable contract based on exchange-for-physical delivery, with a cash-settlement option.
Those are exchange-specific details. They do not establish the rules of a broker’s CFD, a small-sized contract or another cash-settled product. Check the exact product documentation when reading a position or comparing exposure. CrowdSent’s guide to contract size and quote units explains why a familiar market name is not enough to calculate a position’s value.
Why the Brent–WTI spread changes
First state the subtraction order. In this article, the Brent–WTI spread means the Brent price minus the WTI price. A positive value therefore means Brent is higher in the chosen comparison. Reversing the subtraction reverses the sign, even though the underlying prices are unchanged.
Then ask whether the inputs are comparable. Use the same currency and unit, comparable delivery months, and a consistent timestamp or settlement convention. If one quote is a current trade and the other is yesterday’s settlement, the result mixes benchmark differences with time differences.
A widening spread could arise because Brent rose faster, because WTI fell faster, or because one rose while the other fell. These paths are economically different. Preserve the two outright prices alongside the spread so that a single derived number does not hide what happened.
A persistent differential also does not establish a freely available arbitrage. An executable physical comparison would require transport, quality adjustments, timing, financing and access to the necessary facilities. A chart provides observations. It does not demonstrate that a reader can buy one barrel and sell another on the displayed terms.
Worked example: separate the spread from the price move
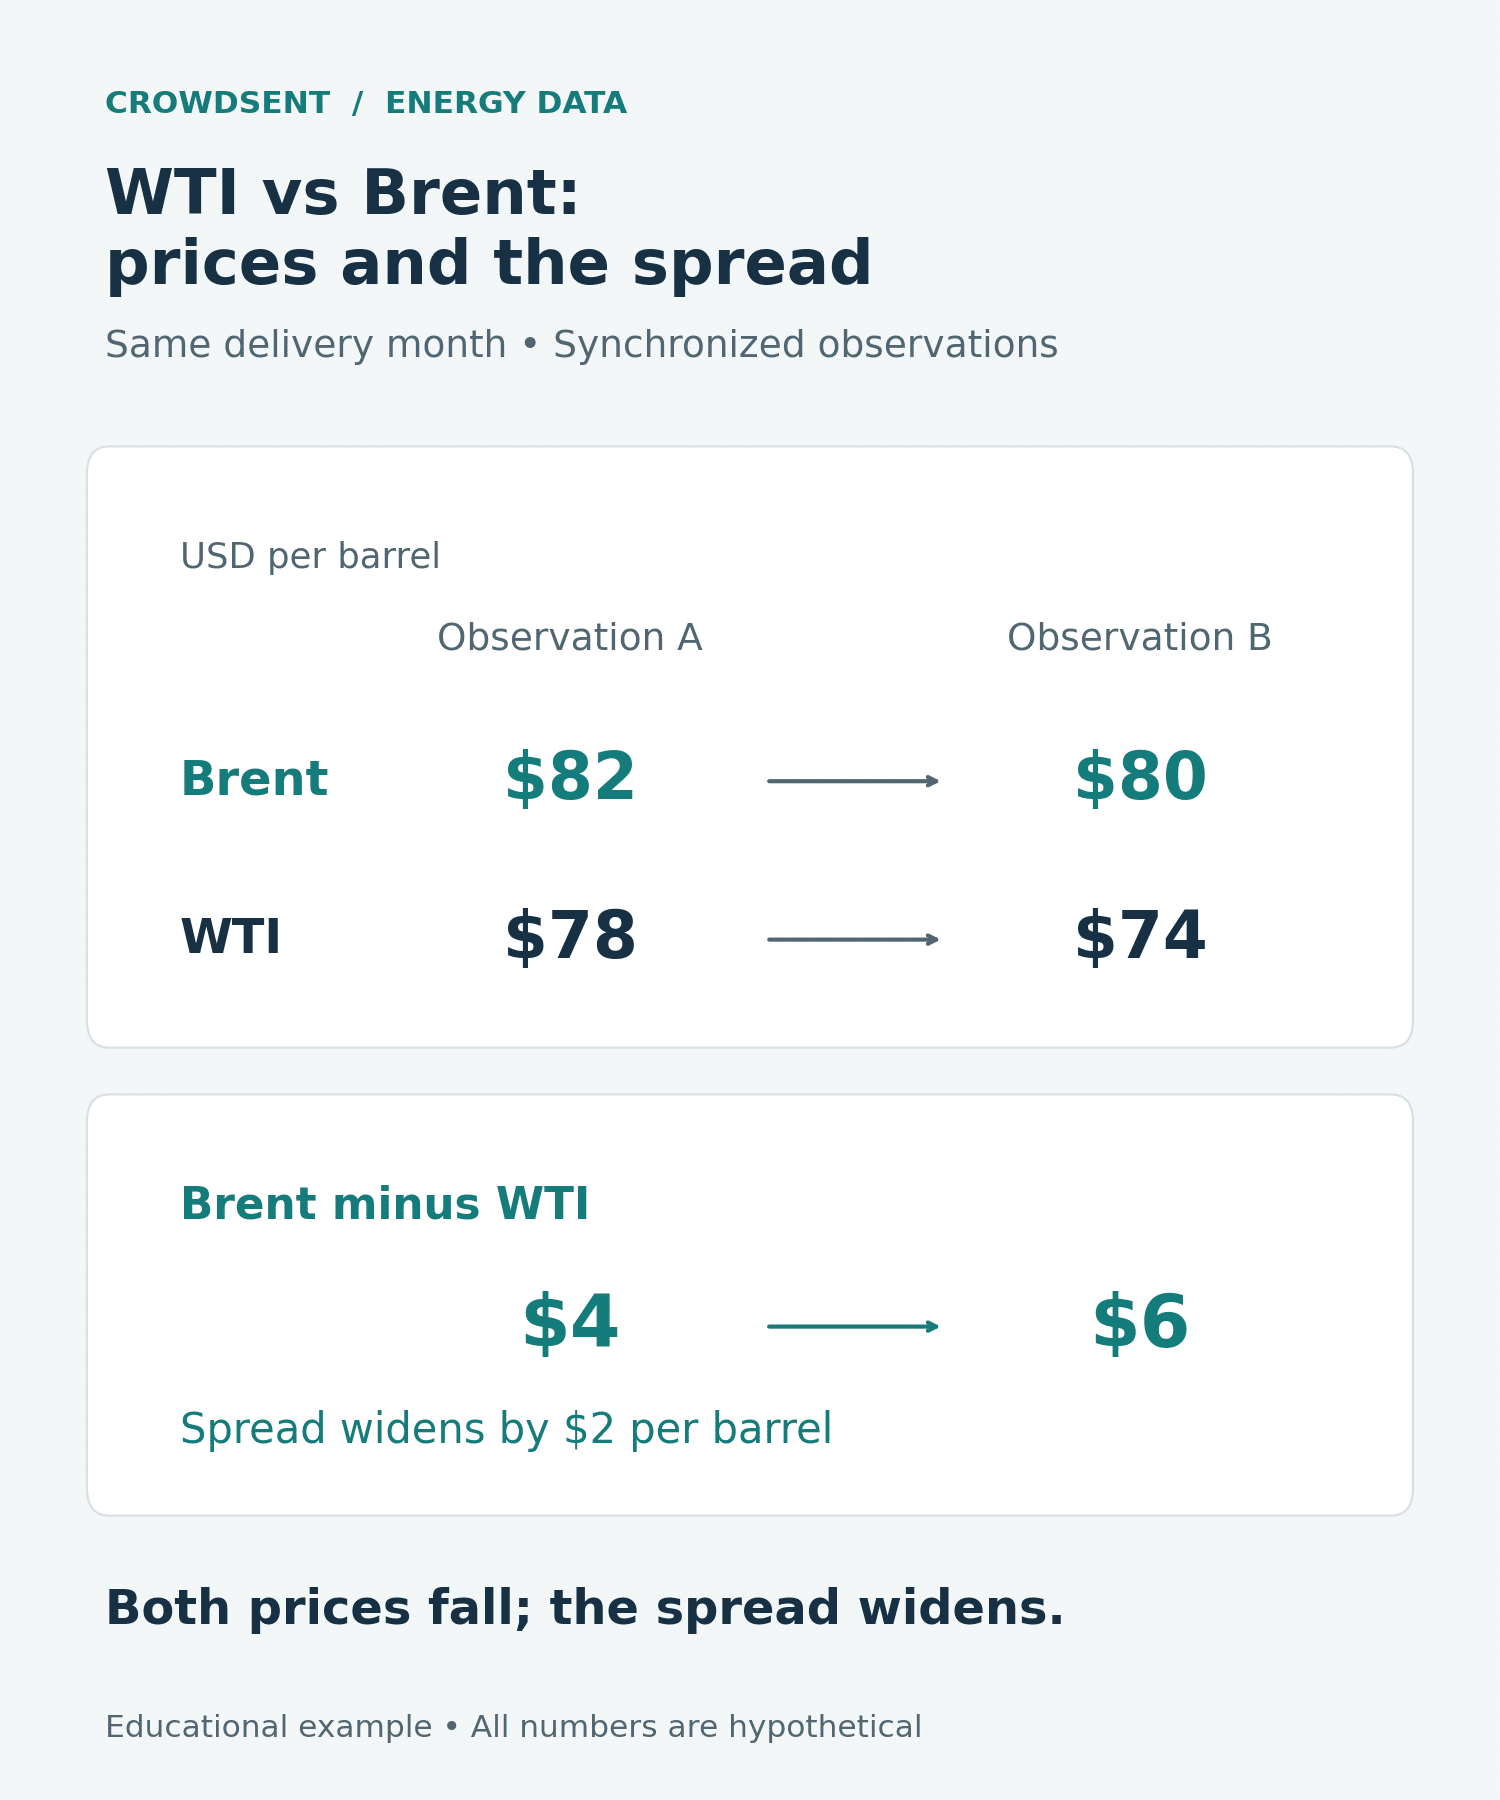
Consider a hypothetical comparison of two specified futures contracts for the same delivery month. At the first observation, Brent is $82 per barrel and WTI is $78. The Brent–WTI spread is $82 minus $78, or $4 per barrel.
At a second synchronized observation, Brent is $80 and WTI is $74. The spread is now $6. It widened by $2 even though both outright prices fell. A note saying “the oil spread strengthened” would therefore leave out the broader price decline.
The percentage moves tell another part of the story. Brent fell $2 divided by $82, approximately 2.44%. WTI fell $4 divided by $78, approximately 5.13%. The comparison supports the narrow observation that WTI declined more over this interval. It does not identify the cause.
Now suppose the WTI feed quietly switched to a later contract priced at $75 while the Brent series stayed unchanged. The displayed spread would become $5. That change could be a chart-construction effect rather than a new physical-market development. Recalculate using the intended contracts before writing an explanation.
These prices are invented solely to demonstrate the arithmetic. A clear record would retain the two instrument identifiers, delivery months, source timestamps, prices, subtraction order and any rollover treatment. With those fields, another reader can reproduce the calculation instead of trusting the label.
How the other energy indicators fit around the benchmarks
Benchmarks answer the price-reference question. Other data help investigate the conditions around that price. Crude inventories describe quantities held in a defined system; refinery utilization relates processing activity to capacity; crack spreads compare selected product prices with crude input prices. Each addresses a different part of the oil chain.
Use that sequence to keep a research note coherent. If the question concerns raw crude availability, inventory and flow data deserve attention. If the question concerns conversion into fuels, processing activity and product prices are more directly relevant. Natural gas storage belongs to a separate fuel balance and should not be treated as another measure of crude-oil supply.
This is an organizing framework, not a formula that converts several indicators into a guaranteed price direction. The same inventory move can occur under different operating conditions. The benchmark comparison remains useful precisely because it gives those explanations a specific price series to explain.
Build a short evidence chain
Start with the observation: which exact price changed, over what interval? Next write a possible mechanism. Then identify the independent evidence needed to test it. A transport explanation, for example, needs information about the relevant route rather than a general headline about oil.
When a claim comes from social media or a market summary, trace it back to its original release. The market-news verification guide provides a practical way to check the source, date and scope. A convincing explanation should survive those checks before it becomes part of your market narrative.
Common comparison errors to avoid
Avoid mixing a spot assessment with a futures price without explicitly making that distinction. Avoid comparing two “front months” without checking their actual delivery months. Avoid treating a continuous chart’s historical adjustment as a transaction price. Finally, avoid turning a short-lived spread move into a claim about a permanent benchmark premium.
For readers in India or Pakistan, currency adds another layer when the question concerns local costs. A dollar-per-barrel benchmark and a domestic-currency fuel price describe different stages of the pricing chain. Any comparison needs the exchange-rate date and the other relevant costs; a direct visual match between the charts is not a complete explanation.
Frequently asked questions
1. Is WTI the same as crude oil?
WTI is a particular crude-oil reference. Crude oil is the broader category containing many grades and delivery locations. A report saying only “crude” leaves an important identification question open: which benchmark, assessment or contract does it mean?
2. Is Brent always more expensive than WTI?
No permanent price ordering should be assumed. Check the specified instruments and observation period. A positive Brent–WTI spread says Brent is higher in that comparison; it does not establish a rule that must hold at every time or for every delivery month.
3. What does a negative Brent–WTI spread mean?
Using Brent minus WTI, a negative spread means the selected WTI price is higher. Confirm the subtraction convention before interpreting the sign. A provider using WTI minus Brent would display the opposite sign for exactly the same prices.
4. Why can two websites display different Brent prices?
They may use different contracts, timestamps, delayed feeds or spot references. Inspect the source label and price type before assuming one is wrong. A bid, an ask, a last trade and a settlement are also different observations.
5. Does front month mean the same delivery month for both benchmarks?
Not necessarily. Exchanges have distinct expiration calendars, and providers can apply different roll rules. Read the actual month and year for both legs rather than relying on “front month” as proof that the comparison is aligned.
6. Is Dated Brent the same as Brent futures?
No. Dated Brent refers to a physical-market price assessment, while a Brent futures quote refers to an exchange contract for a specified period. Use the distinction when interpreting an apparent gap between news about immediate supply and later-delivery pricing.
7. Can I compare their percentage returns instead of their spread?
Yes, if you use consistent instruments and periods. Percentage returns describe each series’ change relative to its starting price. A dollar spread describes the difference between their price levels. Retaining both helps avoid confusing relative performance with the absolute price gap.
8. Does a wider spread prove that shipping costs increased?
No. Shipping is one possible mechanism to investigate. A spread alone cannot isolate it from other changes. Look for independent route-specific evidence and check whether contract or timestamp differences explain part of the observation.
9. Which benchmark should I use in a research journal?
Use the one matching the question and instrument you are studying. State that choice explicitly and preserve it through the comparison. If both matter, record both rather than silently replacing one with whichever series better fits the story.
10. Can benchmark comparisons predict the next oil-price move?
They organize information and reveal differences worth investigating. They do not guarantee a forecast or a profitable trade. Any interpretation remains conditional on the quality of the inputs, competing explanations and events that arrive after the observation.
Conclusion: identify the price before explaining it
A sound WTI vs Brent comparison begins with a complete label and a reproducible calculation. Match instruments, delivery periods, units and timestamps, then investigate the physical explanation. That habit makes inventories and refining data more useful because each piece of evidence connects to a clearly defined question.
This article is educational and does not provide investment advice.
Source documentation checked 11 October 2026. Educational explanation from the CrowdSent Blog Team. Numerical examples are hypothetical unless explicitly identified otherwise. This article does not provide investment recommendations.