

By CrowdSent Blog Team
The Cboe VIX index translates S&P 500 option prices into an annualized measure of expected 30-day volatility. Learn to read its units, horizon, and limitations before interpreting a headline.
What is the Cboe VIX index?
The Cboe Volatility Index, usually called the VIX, measures the market’s expectation of S&P 500 volatility over the next 30 days as implied by SPX option prices. Its reading is expressed on an annualized percentage scale. It describes priced uncertainty about a particular US equity benchmark, rather than a forecast of the benchmark’s direction.
Three labels should travel with every VIX reading: S&P 500, next 30 days, and annualized volatility. Removing any one of them changes the meaning. A value of 20 is not a 20% probability of a crash, a prediction of a 20% monthly fall, or a measure of every market in the world.
Cboe’s VIX frequently asked questions explain the index and its construction. For general reading, the essential point is that the calculation uses qualifying SPX option quotations across strikes and maturities to maintain a constant 30-day horizon. It is not calculated from a poll of investors’ moods.
You can use the index as one piece of context in a research note. Its usefulness improves when you keep the underlying market and time horizon visible, especially when discussing assets outside US equities.
A worked example: reading a hypothetical VIX of 20
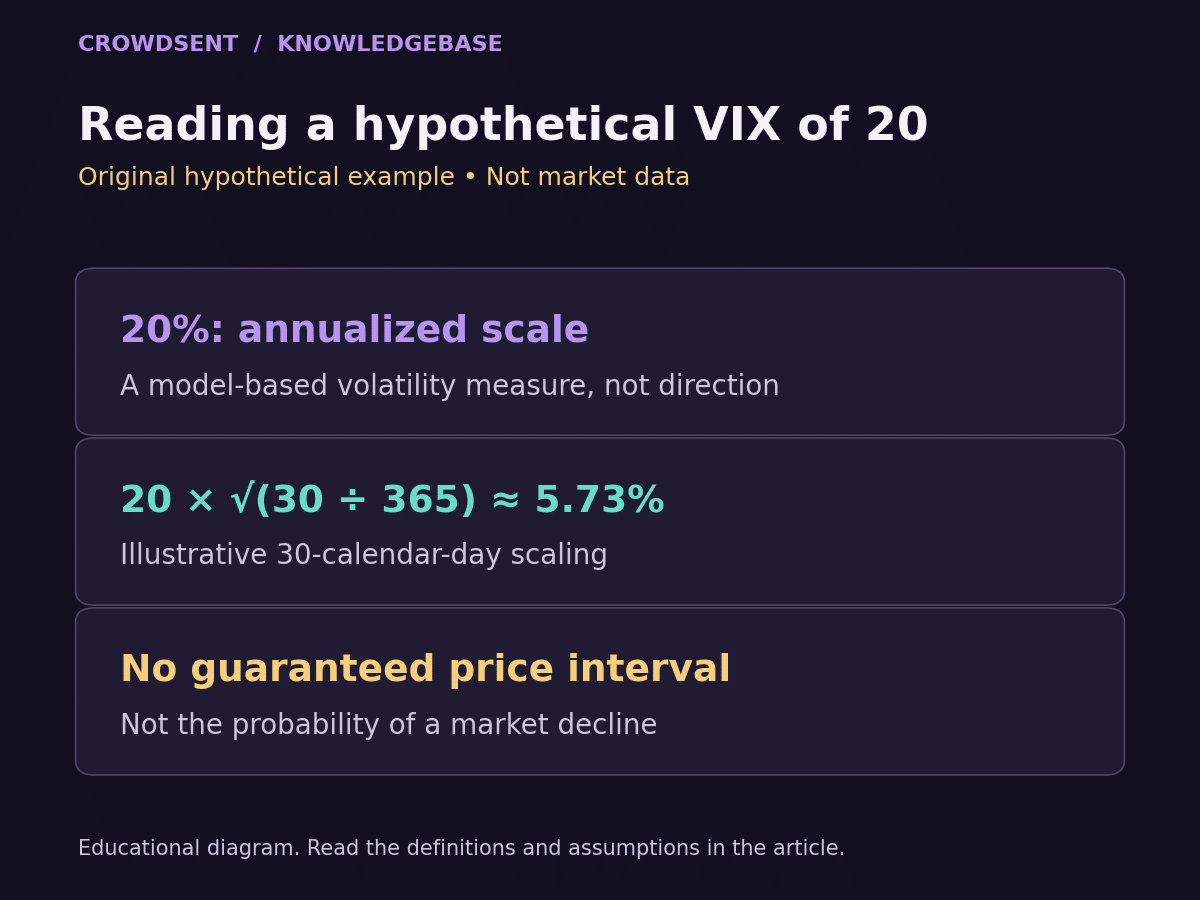
Suppose the VIX reads 20 in a hypothetical example. The reporting scale corresponds to annualized volatility of 20%, while the information in the index concerns the next 30 days. Annualization is a way of expressing the number; it does not turn the measurement into a one-year outlook.
A common simplified conversion estimates a 30-day volatility scale by multiplying 20% by the square root of 30/365. That gives approximately 5.73%. If a hypothetical S&P 500 level were 5,000, 5.73% of that level would be about 287 index points.
This arithmetic translates units. It does not create a promise that the index will remain between approximately 4,713 and 5,287. Nor does it forecast that the next move will be exactly 287 points. Actual returns can have jumps, asymmetry, and unusually large outcomes that a simple range illustration does not capture.
Some explanations attach a roughly 68% probability to a one-standard-deviation interval using a normal-distribution approximation. Treat that as a model illustration, not a verified real-world confidence level for every episode. An option-implied volatility figure alone is insufficient to establish the complete probability distribution of future returns.
Cboe provides a volatility explanation and illustrative range calculator with its own warnings about interpretation. The safest use of the conversion is to understand the scale and units while preserving the uncertainty, rather than turning a convenient formula into a boundary.
Separate the VIX level from its daily change
A market headline may show both the index level and its change. These are different quantities. If a hypothetical VIX moves from 16 to 20, its level rises by 4 index points, and its relative increase is 25%. The new implied annualized volatility reading is 20%, rather than 25%.
A dramatic percentage change can start from a small base. Moving from 10 to 12 is a 20% increase; moving from 30 to 32 is about a 6.7% increase. Both changes add 2 VIX points. Neither comparison can be evaluated well if the article reports only the relative percentage change.
This is also why an unlabeled chart can mislead. A line showing the VIX level and another showing the S&P 500 daily percentage return have different units. Plotting them together may be useful, but the axis labels and observation times must make that difference unmistakable.
When reading a social post, rewrite its claim in a complete sentence: “The index rose from this level to that level during this interval.” That simple step often exposes whether a statement has confused points, percent change, and the volatility percentage itself.
Why “fear gauge” is an incomplete description
The nickname is memorable, but it can encourage readers to imagine that the VIX measures a psychological state directly. Its inputs are option quotations. Calling it a fear gauge does not change those inputs or reveal the motives of every buyer and seller represented in them.
A higher reading is consistent with more expensive priced uncertainty under the index’s methodology. It cannot tell you, by itself, whether market participants are preparing for a fall, a rebound, a policy event, or some combination of scenarios. A specific explanation needs additional evidence.
A hypothetical stock-market rally alongside a higher VIX is therefore not an arithmetic impossibility. The stock index describes the current price level; the volatility index describes uncertainty priced around a future horizon. They measure different dimensions and need not move in opposite directions in every observation.
Likewise, a low reading supplies no guarantee of a calm future. A statistic about currently priced uncertainty cannot rule out information that has not yet arrived. CrowdSent’s guide to what a sentiment score means applies a similar discipline: understand the inputs before assigning an emotional label to the output.
Keep US VIX, India VIX, and other horizons separate
The Cboe VIX uses S&P 500 options. India VIX is a separate index based on NIFTY option quotations, as described by the National Stock Exchange of India. The shared word “VIX” does not make the two series interchangeable.
A reader following Indian equities may want to compare the two as separate observations. A reader following Pakistani equities may use US VIX as external context. In both cases, a US reading should not be relabeled as a direct measurement of local equity-market volatility. The underlying option market remains the one stated in the methodology.
Time horizons differ too. Cboe maintains volatility measures for horizons other than the standard VIX’s 30 days; its term-structure page identifies examples. A short-horizon reading and a longer-horizon reading can diverge because they cover different future intervals.
For an original illustration, imagine an important announcement in five days. A short horizon contains that event as a large part of its interval, while a longer horizon spreads the same date across a broader period. That timing distinction gives a reason to examine the curve without assuming any particular outcome.
The index reading and a product carrying its name
The spot VIX index is a calculated benchmark. Cboe explains that the index itself is not directly tradable. Financial products referencing volatility have their own contracts, holdings, settlement rules, and risks. A product’s label is insufficient evidence that its return will match the daily change in spot VIX.
Suppose a chart shows spot VIX rising by 10%, while a separate instrument with “VIX” in its name rises by less. That discrepancy does not alone prove a pricing error. First identify what the instrument actually references and the period over which its objective is stated.
For an educational article, this distinction is enough: index observations and product returns belong in separate columns. Anyone researching a particular instrument must read that instrument’s own documentation. A general explanation of the benchmark cannot substitute for product-specific terms.
Avoid using a spot-index chart to reconstruct the return of a hypothetical holding unless the linkage and calculation are explicitly established. Otherwise the exercise compares a measured statistic with an imagined financial product.
A practical checklist for reading a VIX headline
- Confirm the full index name and underlying market.
- Record the level, point change, percentage change, and their separate units.
- Check the timestamp, timezone, and whether the observation is delayed or a closing value.
- Identify the horizon; do not assume every volatility index covers 30 days.
- Distinguish spot-index data from futures, options, or fund data.
- Separate the observation from any story about why it moved.
Next, follow the headline back to its source. If it attributes a change to a particular event, compare the publication time, market timestamp, and event timing. CrowdSent’s guide to verifying market news explains how to check whether a narrative is supported by the original evidence.
A useful research journal entry might say: “The hypothetical VIX rose from 16 to 20. This is a 4-point increase and a 25% relative increase. The reading concerns annualized, 30-day S&P 500 implied volatility. The cause is unverified.” That is a complete observation without a borrowed prediction.
Frequently asked questions
What does VIX stand for?
VIX is the familiar ticker-style name for the Cboe Volatility Index. When a source uses the term loosely, confirm the provider and underlying market. Other volatility indexes can share similar names while measuring different option markets or horizons.
Does VIX of 20 mean the S&P 500 will fall 20%?
No. It is an annualized volatility reading associated with a 30-day horizon. It does not specify a negative direction, and 20% is not a forecast monthly loss. Read the reporting scale and measurement horizon separately.
Is a high VIX automatically a buying or selling signal?
No. A high level describes a reading relative to some reference, not a complete decision rule. Defining a threshold after seeing outcomes can also introduce hindsight. This guide explains measurement and does not turn index levels into trade recommendations.
Can VIX and the stock market rise together?
Yes. Their readings concern different dimensions: the stock index’s level and option-priced future variability. Treat claims about their relationship as empirical questions over specified samples, rather than assuming an unbreakable opposite-direction rule.
Is the VIX the same as India VIX?
No. Cboe VIX uses SPX options linked to the S&P 500, while India VIX uses NIFTY options. Keep their provider, underlying market, timestamps, and methodology labels intact when comparing their levels or changes.
Why is VIX annualized if it looks ahead 30 days?
Annualization supplies a common reporting scale. The underlying horizon remains 30 days. This is similar to quoting a short-period rate on an annual basis: the display convention does not change which interval provided the information.
What is the difference between VIX points and percentage change?
A move from 16 to 20 adds 4 index points. Relative to 16, that is a 25% increase. The ending volatility reading is 20 on the index’s scale. All three numbers are valid, but they answer different questions.
Does a low VIX rule out a sudden market shock?
No. Currently priced uncertainty cannot eliminate unanticipated information or rare outcomes. A low observed value should be described with its date and context, without attaching a promise about how quiet the next session or month will be.
Can I compare today’s VIX with an old screenshot?
Only after checking the exact index, timestamp, session, and displayed field. An intraday level, closing value, and derivative settlement value may differ. Old screenshots also often omit the surrounding methodology or whether the quote was delayed.
What should I check before reading a VIX-linked product chart?
Identify the actual instrument, its reference assets, the stated measurement period, and its own methodology. A name containing VIX does not establish that it follows spot VIX one-for-one. Keep benchmark education separate from assumptions about product performance.
Educational information only. Examples are hypothetical and are not forecasts, recommendations, or investment advice.