

By CrowdSent Blog Team
A stock market index is a calculated measure of a selected group of shares. Its movement depends on which securities it includes, how much influence each receives, and the rules used to maintain the calculation. A headline saying the market rose therefore needs one more question: which index, measured in which way?
This guide follows the route from a list of companies to an index level. The aim is to make a factsheet or market headline easier to read. All numerical examples are hypothetical, with simplified assumptions. They explain a measurement process and are not investment recommendations.
What does a stock market index measure?
A stock market index measures the combined performance of securities selected under a defined methodology. Each selected security is a constituent. Its weight determines how strongly its movement affects the whole. The published result is normally an index level expressed in points.
Think of the index as an answer to a specific measurement question. How have large listed companies performed? How have banks performed? How has a defined group of smaller companies performed? Different questions need different constituent lists, so several accurate indices can describe the same exchange and still move in different directions.
India’s securities regulator introduces market indices as indicators of the performance of selected shares and identifies the Sensex and Nifty as familiar examples. Its market index explainer is a useful starting point. The essential habit is to read the selection boundary before interpreting the headline.
How is an index constructed?
Start with a defined universe
The universe is the set of securities the provider is willing to consider. It may be restricted by country, exchange, company size, business activity, or type of share. An index of domestic large companies and an index of every eligible listed company begin with different universes.
Membership rules then narrow that universe. Size may matter, but liquidity, listing history, share availability, and other eligibility conditions can also matter. A familiar name or a large daily price jump does not, by itself, establish that a company belongs in a particular benchmark.
Assign influence through weights
Weights translate constituent movements into an aggregate result. Market-capitalization weighting uses market value; a float-adjusted version uses the part of share capital regarded as available to public investors under the provider’s rules. Price weighting gives higher-priced shares more influence. Equal weighting starts each member with the same proportion at the specified reset.
These choices answer different questions. An equal-weighted basket emphasizes an average member’s performance, while a capitalization-weighted basket reflects the distribution of eligible market value. Neither description tells you whether its next return will be positive.
Maintain a continuous calculation
A benchmark needs rules for company changes as well as ordinary price moves. Shares can split, companies can merge, and constituents can be replaced. The calculation should distinguish economic performance from a mechanical change to its inputs.
Many equity indices use a divisor to scale an aggregate into a manageable points number and make appropriate continuity adjustments. The divisor is part of the index calculation, not a fee deducted from an investor’s account. A factsheet usually gives the broad weighting method; the methodology explains the detailed adjustments.
A worked example: three shares become one index
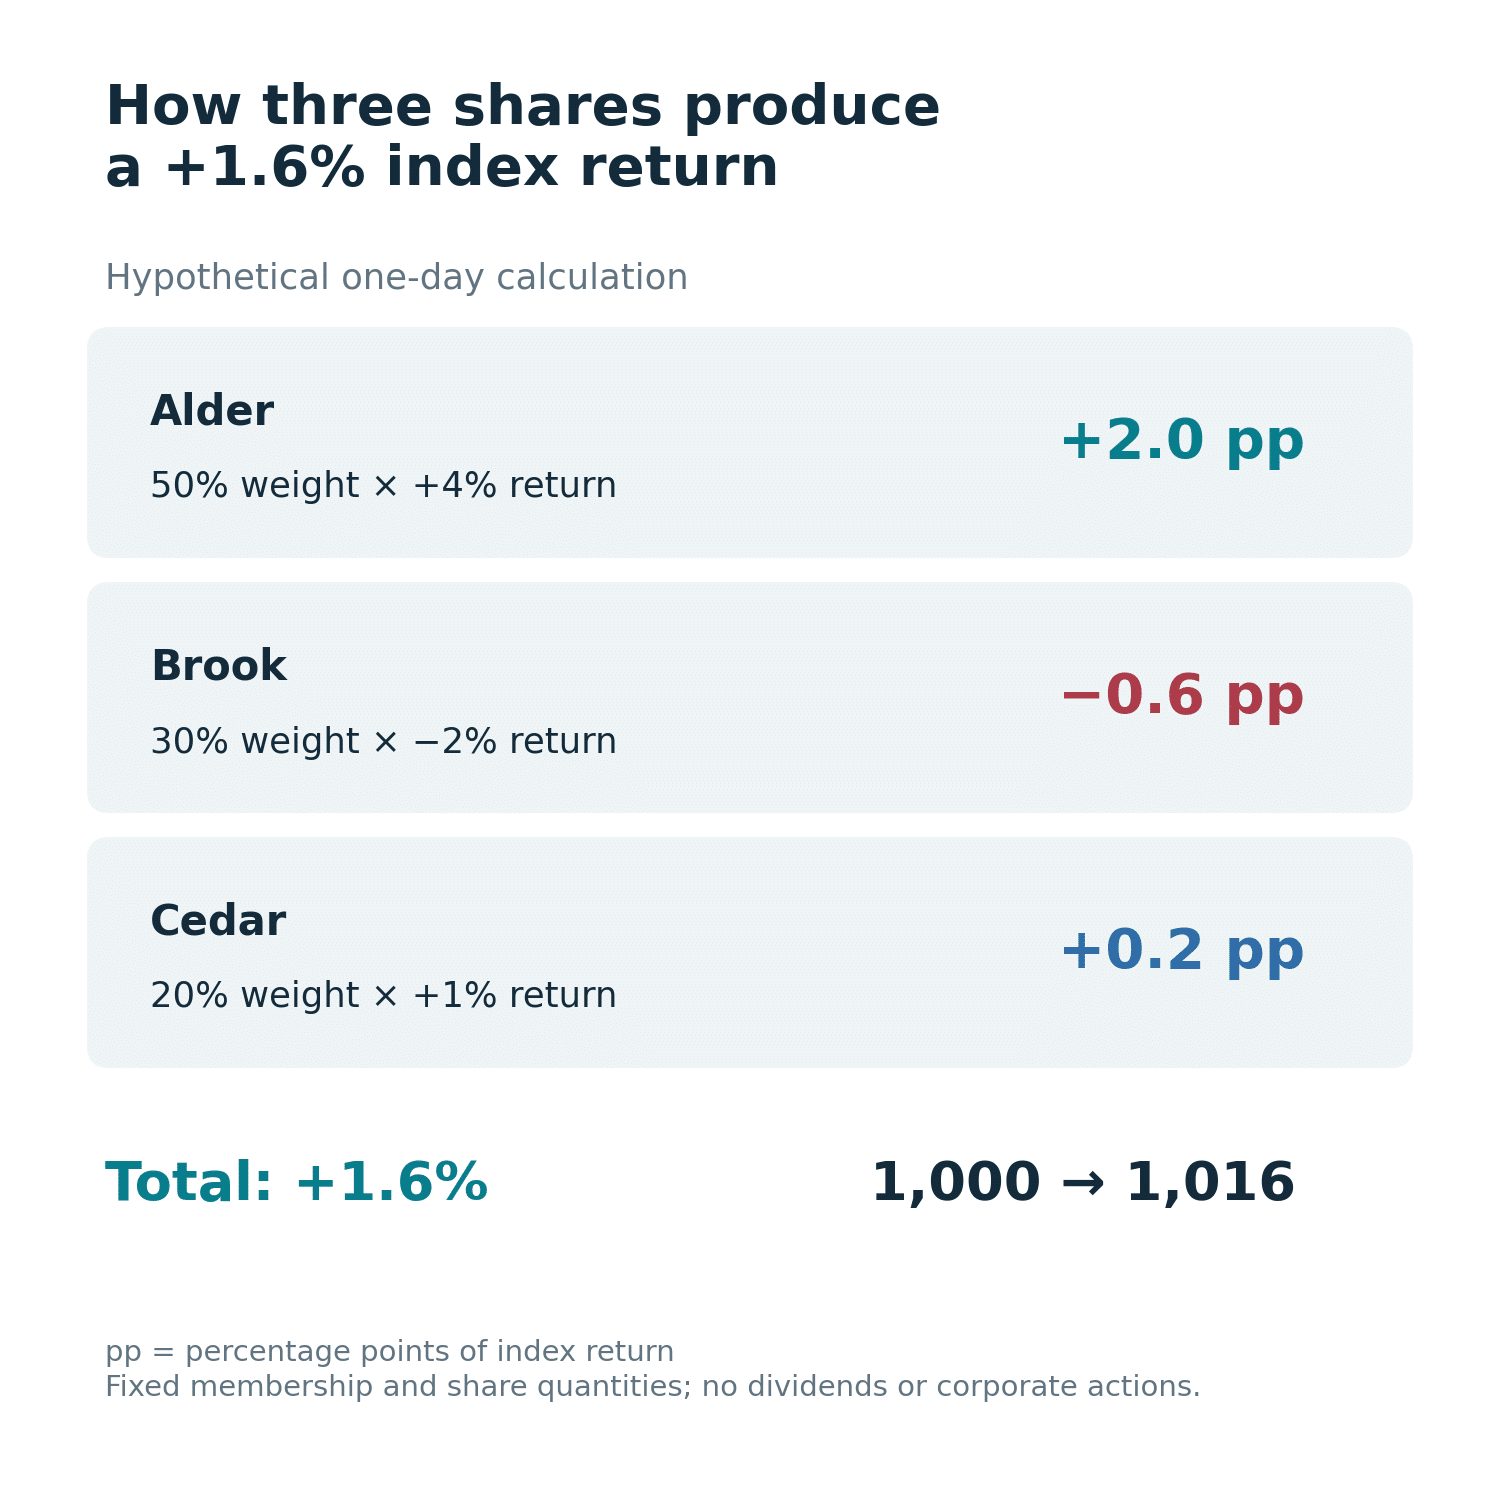
Suppose a hypothetical index contains Alder, Brook, and Cedar. At the start of a single day their weights are 50%, 30%, and 20%. During that day Alder rises 4%, Brook falls 2%, and Cedar rises 1%. Assume the membership and index share quantities stay unchanged and there are no dividends or corporate actions.
Alder contributes 50% × 4% = 2 percentage points. Brook contributes 30% × −2% = −0.6 percentage points. Cedar contributes 20% × 1% = 0.2 percentage points. Adding the contributions gives an index return of 1.6%.
If the index began at 1,000 points, its closing level is 1,000 × 1.016 = 1,016. It gained 16 points. If an otherwise identical series had started the day at 5,000, the same 1.6% movement would have produced an 80-point gain. The larger points change would reflect the scale, rather than stronger performance.
Now give the same three shares equal starting weights. Their one-day average return is (4% − 2% + 1%) ÷ 3 = 1%. The securities and price changes are identical, but the aggregate answer changes because the weights change. This is why comparing index names without comparing construction can be misleading.
Notice also what the first calculation does not say. Two companies rose and one fell; the index rose 1.6%. That result describes weighted performance. It does not report the proportion of all shares on the exchange that rose, the median share’s return, or the experience of every investor.
An index can rise while most of its members fall
Consider a second hypothetical basket with four constituents. One has a starting weight of 70%, while the other three each have 10%. During a single period, the largest constituent rises 3% and each of the others falls 1%. Keep membership, calculation quantities and return treatment unchanged.
The largest constituent contributes 0.70 × 3% = 2.1 percentage points. The other three contribute −0.1 percentage points each, or −0.3 in total. The weighted index therefore rises 1.8%. Yet only one of its four members advances: an advancing share of 25%, with 75% declining. The median constituent return is −1%.
All these statements are consistent. The index measures weighted performance; the advance count measures participation; the median describes the middle of the individual-return distribution. None should be substituted for another merely because each summarizes the same session.
A clear headline could say that the hypothetical index gained 1.8% while three of its four constituents declined. It would be misleading to shorten this to “shares broadly rose.” The calculation shows why reading concentration alongside the headline helps identify what actually drove the result.
Keep the universe fixed when checking this claim. A breadth count for every listing on an exchange does not directly describe a narrower index’s membership. Compare constituent-level participation with the same basket first, then label any wider-market comparison separately.
What do familiar regional benchmarks represent?
The Nifty 50 provider page identifies its free-float market-capitalization method. That tells an Indian reader to examine eligible market value and concentration, rather than assume each of the 50 companies has a 2% weight.
Pakistan Stock Exchange describes the KSE-100 using free-float capitalization and provides both total-return and price-return variants on its official indices page. The full series name matters when comparing performance. The number of constituents alone cannot make two return series comparable.
For a US comparison, S&P Dow Jones Indices describes the S&P 500 as a large-cap benchmark weighted by float-adjusted market capitalization in its US indices methodology. These examples show a shared construction idea across markets, not identical eligibility, review schedules, or company coverage.
How to read an index quote without losing the context
Begin with the exact series name and provider. Then identify its return treatment, calculation currency, timestamp, and comparison period. A daily percentage change measured from the previous close answers a different question from a year-to-date return measured from the preceding year-end.
Next, inspect the largest constituent and sector weights. A positive headline can coexist with widespread weakness if a few influential members rise. Conversely, a weak headline can coexist with strength in many small constituents. Weight concentration and market breadth are related observations, but they measure different things.
Use a small research record containing the series name, observation time, previous reference level, current level, and source. The market research journal guide shows how to preserve assumptions so a comparison can be repeated later.
Check whether a missing quote means the market is closed, the feed is delayed, or the observation is unavailable. It does not automatically mean the index was unchanged. Our guide to missing market data versus zero explains why this distinction matters.
What an index cannot tell you on its own
An equity index does not measure every part of an economy. Unlisted businesses, wages, household spending, and public services can develop differently from the listed companies selected for a benchmark. Even a broad market index has a defined boundary.
It also does not establish why prices moved. A same-day news story may offer a plausible explanation, but several events, expectations, and company-specific developments can overlap. Apply the source checks in how to verify market news before turning timing into a causal claim.
Finally, an index level is not the same thing as an available transaction price. A fund, futures contract, or other linked instrument has its own structure, costs, and risks. Understanding the benchmark is one part of understanding such a product; it does not replace the product’s own documentation.
Frequently asked questions
1. Is a stock exchange the same as an index?
No. An exchange is a trading venue. An index is a calculated benchmark. One exchange can be associated with several indices, and an index provider can select eligible securities from more than one venue. Identify the venue and the benchmark separately.
2. What does an index point mean?
A point is one unit of the index’s chosen scale. Its significance depends on the starting level. A 20-point move from 1,000 is 2%; a 20-point move from 10,000 is 0.2%. Percent changes are usually more useful for performance comparisons.
3. Does a rising index mean most shares rose?
Not necessarily. A small group of heavily weighted shares can outweigh declines elsewhere. To answer how many shares rose, examine a breadth measure with the appropriate universe. The index return and the number of advancing shares are different observations.
4. Can two indices containing the same shares perform differently?
Yes. Different weights, return treatments, currencies, or maintenance rules can produce different results. The worked example shows that changing only the starting weights changes the daily return from 1.6% to 1%, without changing any constituent’s price movement.
5. Is the company count always the security count?
Not always. A company can have multiple eligible share classes, depending on the methodology. A factsheet may report companies, securities, or both. Check what the count refers to before using it as a measure of diversification.
6. Can you buy an index directly?
The index itself is a calculation. Products may seek to track it or provide exposure linked to it. Those products introduce their own terms, implementation choices, and possible differences from the benchmark. The index level alone does not describe those features.
7. Why does index membership change?
Companies and markets change. A constituent may no longer meet eligibility rules, another may qualify, or a merger may remove a listed security. The provider’s scheduled reviews and event policies determine how those changes enter the benchmark.
8. Is a higher index level evidence of a more expensive market?
No. Different indices use different starting values and histories. Comparing 50,000 points with 5,000 points does not establish a valuation difference. A valuation comparison needs a consistently defined measure and comparable constituent data.
9. How should indices in different currencies be compared?
First decide whether the question concerns local-market performance or the return translated into a common currency. Use matching dates and return variants. Exchange-rate movements can change the common-currency comparison even when local equity prices are unchanged.
10. Where should a beginner check the rules?
Start with the provider’s current factsheet, then open its methodology and recent change notices. Record the document date. A third-party chart may be convenient, but it can omit the weighting details or abbreviate the exact series name.
Conclusion: read the measurement behind the headline
A useful index comparison starts with constituents, weights, and calculation rules. Points show the level; percentage changes describe movement; the methodology explains what that movement represents. Once those pieces are clear, an index becomes a more precise research reference.
This article is educational and does not provide financial advice.
Source documentation checked 11 October 2026. Educational explanation from the CrowdSent Blog Team. Numerical examples are hypothetical unless explicitly identified otherwise. This article does not provide investment recommendations.