

Segment reporting breaks a company’s activities into defined business views and connects those views to the company’s financial totals. To interpret a segment note, identify what each segment contains, separate external sales from internal transfers, and read the profit reconciliation.
In the fictional example below, revenue and both business-line margins remain steady, yet combined profit falls. The explanation is the proportion of sales coming from each business.
Start segment reporting with the business definitions
The IFRS Foundation’s IFRS 8 overview describes disclosures about business activities and economic environments, along with related product, geographic and major-customer information. Read the note’s definition before assuming every named category is a separate operating segment.
Record which activities sit inside each segment label and whether their scope changed.
A segment also need not coincide with a legal subsidiary. The IFRS-aligned Australian AASB 8 standard uses management’s reporting view and calls for explanations of measurements and reconciliations. It is cited here for reporting mechanics, not as a substitute for another country’s filing requirements.
Separate external revenue from transfers between segments
Separate one-period illustration: Segment A reports CU700 million of revenue, including CU100 million transferred to Segment B. B reports CU400 million of external revenue. Adding the displayed segment totals gives CU1,100 million, but CU100 million is internal.
Company external revenue = 700 + 400 − 100 = CU1,000 million. Check it from the outside-customer view: A’s external CU600 million plus B’s CU400 million gives the same CU1,000 million.
Keep segment revenue and external revenue in separate worksheet fields. Do not subtract a guessed transfer amount to force a match.
This short illustration is separate from the two-year example that follows. The next example assumes no intersegment sales, so its changing mix can be examined without an elimination adjustment.
Find what the segment profit measure includes
Copy the profit definition before calculating a margin. Identify included expenses, costs handled outside the measure and the matching revenue basis.
Required segment information also has its own reporting context. The SEC Financial Reporting Manual, Topic 8 distinguishes segment measures consistent with the relevant US accounting requirements from non-GAAP measures. An unfamiliar segment-profit label does not automatically make it an optional adjusted-earnings measure.
For the main example, define segment profit as operating contribution before central costs, interest and tax. That is an invented definition for this exercise, not a claim about how any actual issuer calculates its segment result.
Follow unchanged segment margins through a changing sales mix
Main example assumptions: all amounts are fictional CU million. Both years have matching periods, consistent segment definitions, unchanged cost-allocation methods and no intersegment sales. A’s margin stays at 15%; B’s stays at 10%.
Year 1: A has CU600 of external revenue and CU90 of segment profit. B has CU400 of external revenue and CU40 of segment profit. Revenue totals CU1,000, and segment profit totals CU130. The combined segment-profit margin is 130 ÷ 1,000 = 13%.
Year 2: A’s external revenue becomes CU400 and its segment profit CU60. B’s external revenue becomes CU600 and its segment profit CU60. Total revenue remains CU1,000, while total segment profit becomes CU120. The combined margin is 12%.
Check each business separately: 90 ÷ 600 and 60 ÷ 400 both equal A’s 15%; 40 ÷ 400 and 60 ÷ 600 both equal B’s 10%. No business-line margin deteriorated in the example.
What changed is the revenue weighting. A, the higher-margin business, falls from 60% to 40% of total sales. The weighted calculation moves from 60% × 15% + 40% × 10% = 13%, to 40% × 15% + 60% × 10% = 12%.
The equal average of 15% and 10% is 12.5% in both years. It misses the shift because it gives each business the same weight regardless of sales. Use the actual revenue weights when explaining the combined sales-based margin.
Reconcile segment profit to the company result
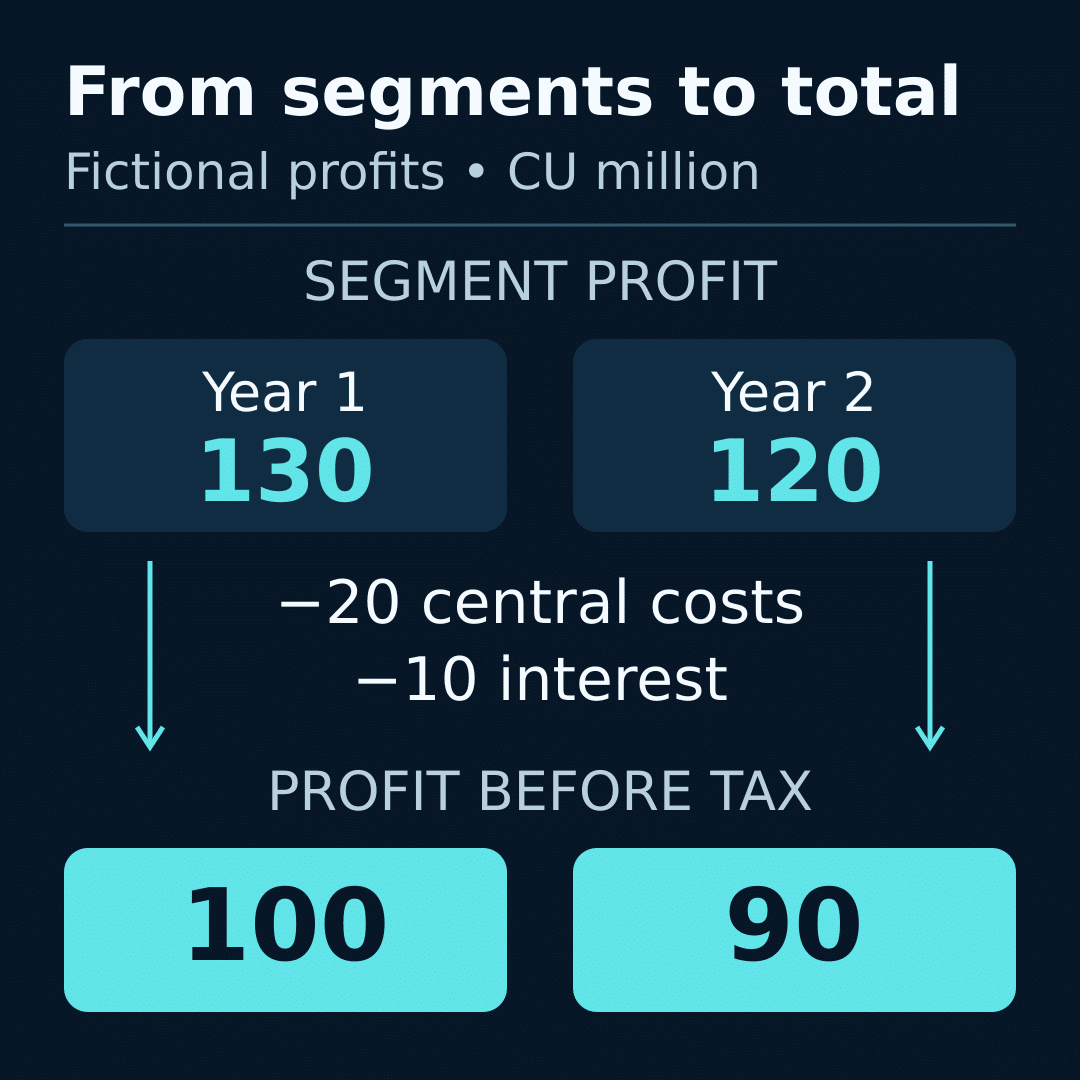
Continue with the main example. Assume central costs of CU20 and interest of CU10 in each year. The supplied illustrative tax amounts are CU25 in Year 1 and CU22.5 in Year 2. These rows describe only this fictional reconciliation.
Year 1: CU130 segment profit − CU20 central costs − CU10 interest = CU100 profit before tax. Subtract the supplied CU25 tax amount to reach CU75 net profit.
Year 2: CU120 segment profit − CU20 central costs − CU10 interest = CU90 profit before tax. Subtract CU22.5 to reach CU67.5 net profit.
The CU10 decline in total segment profit carries through to profit before tax because the two intervening cost rows are unchanged. Net profit falls CU7.5 after the different supplied tax amounts. The explanation is visible row by row, without treating CU120 as the final company profit.
Use the actual report’s reconciliation labels and endpoint. Do not substitute the example’s rows for the company’s definitions.
Check whether this year’s segment matches last year’s
AASB 8 addresses changed segment composition and comparative information. For reading purposes, check whether earlier figures were recast and whether the report explains the new grouping. Keep the comparison’s scope visible.
If a service moves from A to B, a label-to-label growth rate could mix that transfer with changes in underlying sales. Seek comparable figures or record why the comparison remains incomplete.
Do not fill an absent older segment value with zero. The missing-data checklist helps preserve the distinction between an unavailable comparison and a genuinely measured zero.
Write the conclusion with its boundaries intact
For the main example, a precise conclusion is: “Revenue stayed CU1,000 million. A’s share of sales fell from 60% to 40%, lowering the combined segment-profit margin from 13% to 12%. Fixed central costs and interest left profit before tax at CU90 million.”
Save the segment definitions, external-sales weights, margin calculations and reconciliation in a market research journal. When a summary conflicts with the filing, use the source-verification checklist to locate the relevant note and version. The aim is to explain the reported period, with unresolved scope changes clearly marked.
Frequently asked questions
Is every subsidiary a reportable segment?
No. A legal-entity list and a management reporting view answer different questions. Read the segment note’s description before matching labels to subsidiaries.
Are geographic revenue disclosures always operating segments?
No. Geographic information can be a separate disclosure about the company’s activity. Check the table heading and surrounding explanation. A country appearing in a revenue breakdown does not alone establish that it is a reportable operating segment.
Why can segment revenues add up to more than company revenue?
The separate illustration includes CU100 of transfers inside the business. Adding CU700 and CU400 gives CU1,100, then removing the internal CU100 gives CU1,000 of external revenue. Check whether the actual note includes a similar reconciliation.
Is segment profit necessarily net income?
No. In the main example, Year 2 segment profit totals CU120 before central costs, interest and tax. The final net profit is CU67.5. Copying CU120 into a net-income field would change the measure being reported.
Can combined margins fall while each segment margin stays unchanged?
Yes. A stays at 15% and B at 10%, but a larger share of sales moves to B. The combined segment-profit margin falls from 13% to 12%. The weights explain the change without a decline in either individual margin.
Should segment margins be averaged equally?
For the combined sales-based margin, use matching revenue weights. The equal average gives 12.5% in both fictional years, whereas the actual weighted margins are 13% and 12%. An equal average answers a different mathematical question.
Does an unallocated corporate cost have no economic effect?
In the fictional reconciliation, CU20 of central costs sits outside the segment measures but still reduces company profit. The presentation location does not remove the cost. Keep it visible when moving from segment totals to the company result.
Can a renamed segment be compared directly with the old label?
Check whether the underlying activities changed and whether comparable prior-period figures are available. A rename alone need not change scope, but a transfer of business can. Preserve that distinction before describing label-to-label changes as growth.
Does one reportable segment mean the company has one product?
The number of reportable segments does not by itself count products. Product categories and the management reporting view can be organised differently.
What if a reconciliation line is unclear?
Keep its exact label, sign, amount and source reference, then inspect the explanation. Do not allocate it across segments by assumption. An unresolved line can be a documented limitation without being labelled an error or ignored.
Sources checked 13 October 2026. Educational content only. All numerical examples are fictional and are not current market data or investment recommendations.