

By CrowdSent Blog Team
A price weighted index assigns influence according to each share’s price. A market-cap-weighted index assigns influence according to the market value of the shares counted in its calculation. Because share price and company size are different quantities, these methods can produce sharply different results from the same constituents.
The useful comparison is not simply which method sounds more familiar. It is what each method measures, which company dominates the calculation, and how corporate changes affect that influence. This guide keeps the companies and daily returns fixed so the effect of weighting is visible.
All examples are hypothetical and educational.
Jump to the key difference, the worked comparison, stock splits, comparison checks, or the FAQs.
How does a price weighted index differ from market-cap weighting?
In a simple price-weighted index, a constituent’s weight equals its share price divided by the sum of constituent share prices. A share quoted at 120 has twice the starting weight of a share quoted at 60, regardless of how many shares either company has outstanding.
In an uncapped full-market-cap-weighted index, the weight equals the constituent’s market capitalization divided by total constituent market capitalization. Market capitalization is price multiplied by the relevant shares outstanding. For a float-adjusted index, the calculation also accounts for eligible free float.
The S&P DJI explanation of weighting methods distinguishes these approaches. Reading the method is essential: a high nominal share price can create a large price weight even when the company’s total equity market value is comparatively small.
Worked comparison: identical shares, opposite index directions
The starting inputs
Build two hypothetical indices from companies A, B, and C. Use one common currency. Company A has a price of 120 and 1 million shares. Company B has a price of 60 and 6 million shares. Company C has a price of 20 and 6 million shares.
The sum of prices is 120 + 60 + 20 = 200. The corresponding market capitalizations are 120 million, 360 million, and 120 million, totaling 600 million. For this example, all shares count, and there are no free-float adjustments or weight caps.
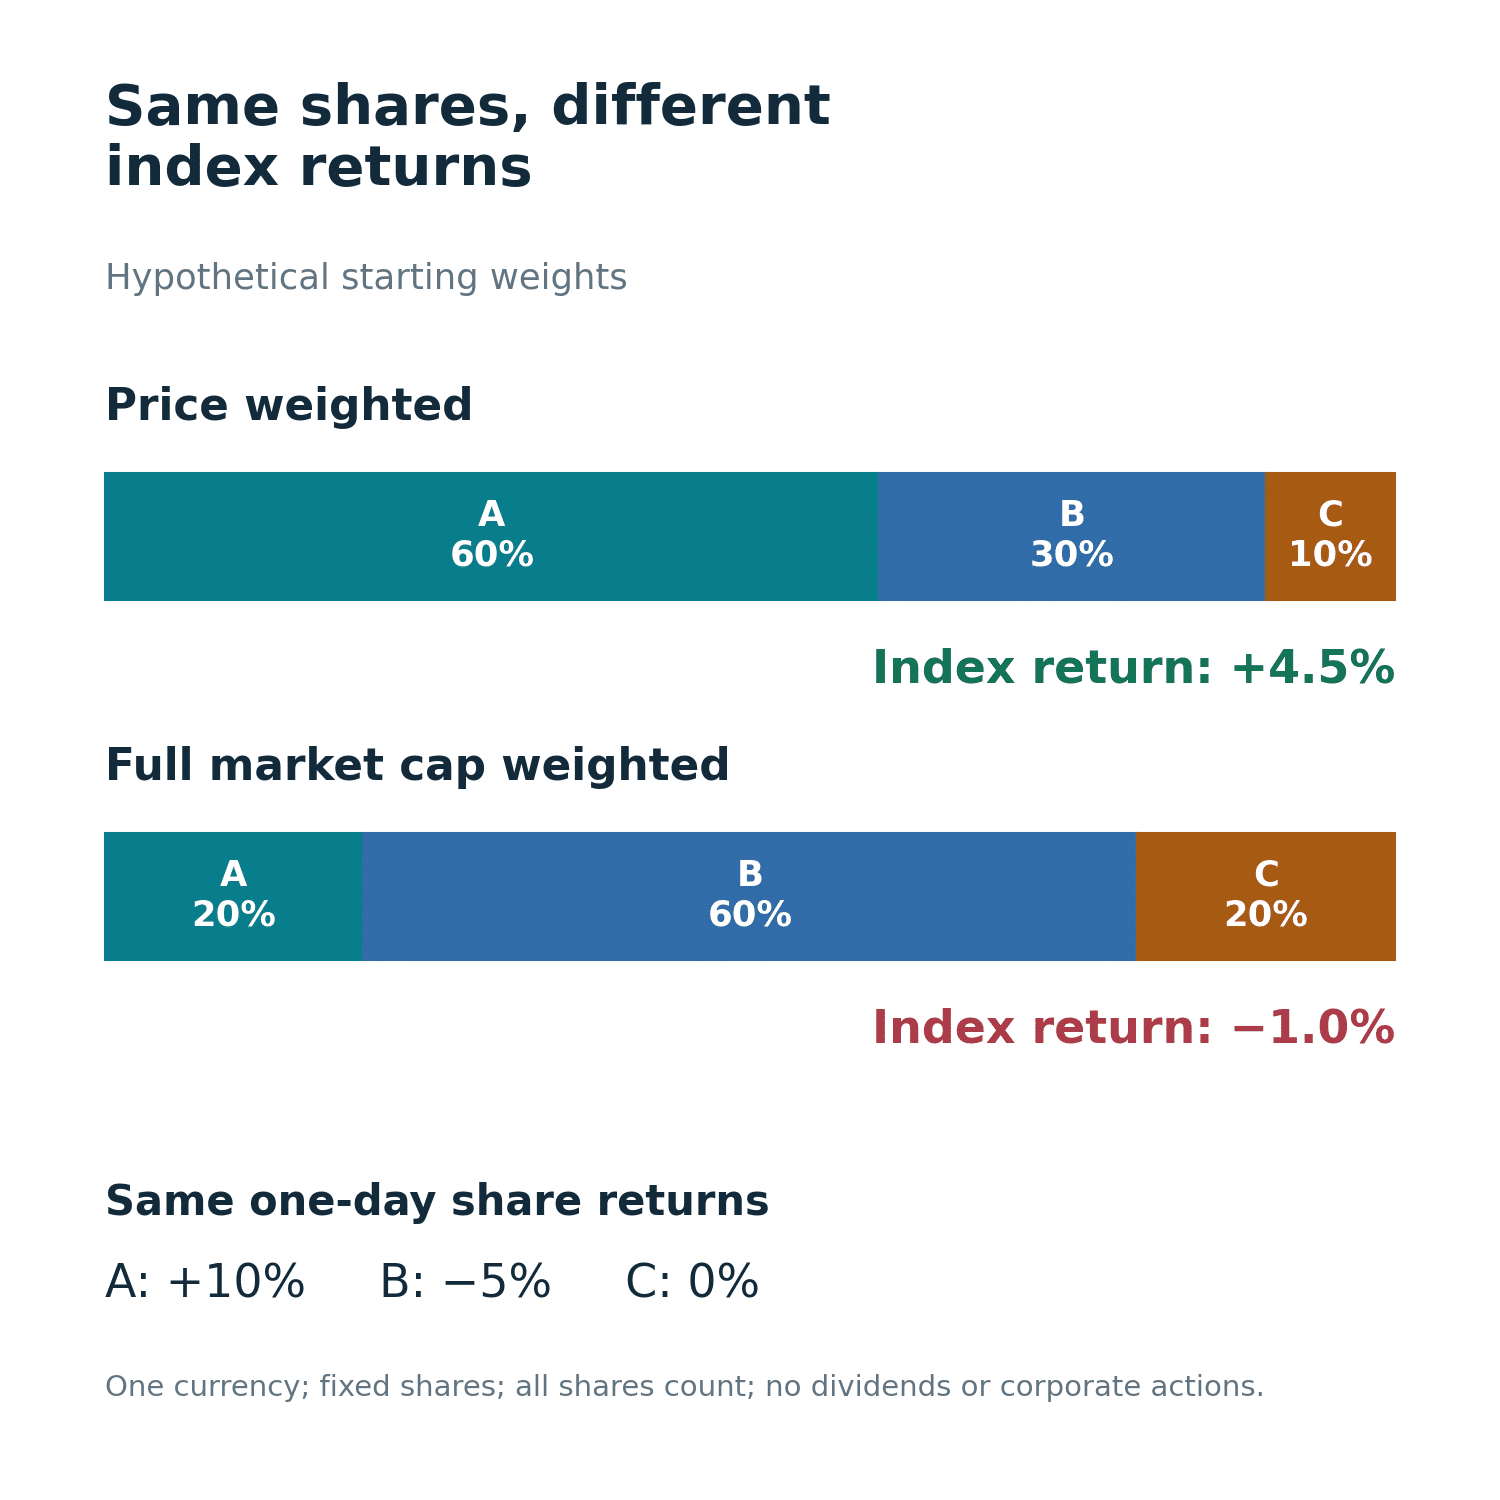
Price weighting therefore gives A 60%, B 30%, and C 10%. Market-cap weighting gives A 20%, B 60%, and C 20%. A is the most influential price-weighted constituent; B is the most influential market-cap-weighted constituent. The membership list by itself would not reveal this reversal.
Apply the same one-day price movements
Suppose A rises 10%, B falls 5%, and C is unchanged. Their new prices are 132, 57, and 20. Assume no dividend, split, membership change, or change in shares outstanding during the day.
The price-weighted return is (60% × 10%) + (30% × −5%) + (10% × 0%) = 4.5%. You can check it using the price sum: 209 ÷ 200 − 1 = 4.5%.
The market-cap-weighted return is (20% × 10%) + (60% × −5%) + (20% × 0%) = −1%. The new total capitalization is 132 million + 342 million + 120 million = 594 million. Dividing 594 million by the starting 600 million confirms a 1% decline.
If both indices start at 1,000 points, the first closes at 1,045 and the second at 990. Neither calculation is wrong. They answer differently weighted questions. This is a practical reason to avoid describing an index move as though every constituent had the same experience.
Keep the contribution unit clear
In the price-weighted version, A adds 6 percentage points to the index return and B subtracts 1.5 percentage points. Those are contributions to the aggregate return, not the shares’ own returns. A’s own return remains 10% in both versions.
A common spreadsheet mistake is to combine a closing weight with a return measured from the previous close. For this single-period calculation, use the starting weights. A’s closing weight rises after its price increase, so using that later weight would overstate its contribution.
Explain the return gap through weight differences
The controlled example also lets you attribute the gap between the two index returns. Subtract each market-cap starting weight from its price-based starting weight. The differences are 40 percentage points for A, −30 percentage points for B, and −10 percentage points for C. These differences sum to zero because both sets of weights sum to 100%.
Multiply each weight difference, expressed as a decimal, by the matching constituent return. A contributes 0.40 × 10% = 4 percentage points to the gap. B contributes −0.30 × −5% = 1.5 percentage points. C contributes −0.10 × 0% = zero. The total gap is 5.5 percentage points, matching 4.5% minus −1%.
The positive contribution from B may initially look surprising. B fell, but the price-weighted version assigned less weight to that decline. Relative to the capitalization-weighted version, this reduced the drag. Attribution asks how the different exposure affected the comparison, rather than whether the constituent itself rose.
As a useful check, give every constituent the same 2% return. Each index then returns 2%, regardless of these different starting weights. The weighted gap is zero because the weight differences sum to zero. A weighting difference changes results when constituent returns differ; it does not automatically produce a performance gap in every period.
This calculation assumes the same constituents, single-period returns and unchanged calculation quantities already specified. It should not be applied unchanged across a constituent replacement or a multi-period interval with changing weights.
Why an equal currency move differs from an equal percentage move
In a simple price-weighted calculation with an unchanged divisor, a one-unit price increase in any constituent adds the same number of index points. This follows because each increase adds one unit to the sum of prices.
But a 10% increase is not the same currency move for every share. At the example’s starting prices, 10% of 120 is 12, while 10% of 20 is 2. A contributes six times as much to the price sum for the same percentage return.
For the full-cap calculation, a one-unit move in A adds 1 million to capitalization, while a one-unit move in B adds 6 million. The relevant share quantity changes the influence. Always specify whether a comparison holds the currency move or the percentage move constant.
What happens when a constituent splits its shares?
Return to the original starting inputs. Suppose A completes a two-for-one split: its price adjusts from 120 to 60 and its share count from 1 million to 2 million, with no other changes. Its hypothetical capitalization stays at 120 million.
The full-cap weights therefore remain 20%, 60%, and 20%. In the price-weighted basket, the price sum falls mechanically from 200 to 140. A continuity adjustment is needed so this bookkeeping change does not become a false 30% index loss.
For an index initially at 1,000, the old price divisor is 200 ÷ 1,000 = 0.2. The new divisor becomes 140 ÷ 1,000 = 0.14, preserving the 1,000-point level at the adjustment. This illustrates the continuity mechanism; it is not a real index’s current divisor.
Afterward, the price weights are approximately 42.86%, 42.86%, and 14.29%. The adjustment preserves the level, but A’s future influence has changed. It no longer has twice B’s price weight. S&P DJI’s Index Mathematics Methodology documents the distinction between price-weighted calculation and corporate-action adjustments.
Where do real benchmarks fit?
The Dow Jones Averages methodology identifies the Dow Jones Industrial Average as a 30-stock, price-weighted index. Its recognizable name does not make price weighting a universal convention.
For a capitalization-based example, NSE Indices’ calculation tutorial sets out full-market-cap and free-float calculations. The distinction matters when a large block of a company’s shares is excluded from the index’s investable share count.
The worked comparison above deliberately removes those extra rules. A real comparison may also involve different constituents, eligibility screens, currencies, or caps. You cannot attribute the entire observed return gap between two unrelated real indices to weighting alone.
How to compare weighting methods in research
Start by holding as many variables constant as possible: constituent list, observation window, price source, currency, and dividend treatment. Then compare starting weights and return contributions. Where those inputs differ, describe the comparison as a broader benchmark comparison rather than a clean weighting experiment.
Write down the share basis. Total shares, float-adjusted shares, and a capped or otherwise modified index quantity can produce different weights. The general lesson that price and aggregate size differ also appears in our crypto market cap versus price guide, although token-supply definitions are distinct from equity share-count rules.
Do not interpret a heavy index weight as proof of easy execution. The shares available, order-book conditions, and intended transaction size still matter. Our liquidity versus volume explainer separates an activity measure from the ability to trade at a particular price.
Finally, save the exact assumptions beside the calculation. A consistent research journal is useful when a later split or constituent update would otherwise make a previous example hard to reproduce.
Frequently asked questions
1. Does a high share price mean a company is larger?
No. Size measured by equity market capitalization also depends on shares outstanding. In the example, A has the highest share price but only one-third of B’s capitalization. Comparing prices alone leaves out the share-count denominator.
2. Is a price-weighted index an equal-weighted index?
No. Equal share quantities create price weighting, while equal starting monetary values create equal weights. Holding one share priced at 120 and one priced at 60 gives the first twice as much initial monetary exposure.
3. Are all market-cap-weighted indices float adjusted?
No. Full-cap and float-adjusted calculations are separate possibilities. Some indices also apply caps or other modifications. Read the complete weighting description rather than assume that the phrase market-cap weighted specifies every input.
4. Does a stock split create an index profit or loss?
A pure split should not create an artificial return. The required treatment depends on the methodology. The worked split preserves capitalization automatically and uses a revised price divisor to preserve the price-weighted level.
5. Does a divisor adjustment keep every weight unchanged?
No. A common scaling adjustment preserves the aggregate level at the event. It does not necessarily preserve relative constituent influence. After A’s split in the example, its price-weighted share of the basket falls even though the index level is continuous.
6. Which method is more diversified?
The label alone cannot answer that. Compare actual weights, sector concentration, and constituent relationships. A capitalization-weighted index can be dominated by a few large companies; a price-weighted index can be dominated by a few high-priced shares.
7. Will market-cap weights stay fixed between reviews?
No. Even with unchanged shares and float factors, relative price movements change weights. A company that rises faster than the rest generally gains weight. Routine price-driven drift is different from a scheduled change to the index’s inputs.
8. Can a small company dominate a price-weighted basket?
Yes, if its nominal share price is high enough relative to the other members. Price weighting does not use shares outstanding to determine relative influence. Eligibility rules may limit membership, but they are separate from the weighting formula.
9. Is one method always more profitable?
No. Relative results depend on which constituents perform well and how much weight they receive. The example demonstrates a possible difference, not a forecast or a historical claim. Reversing the price movements would change the comparison.
10. What is the fastest way to check a weighting claim?
Open the provider’s current methodology and find the weighting section. Then compare a dated constituent-weight file with the required price and share inputs. Allow for float factors, caps, and rounding before concluding the published weights are inconsistent.
Conclusion: find the source of influence
The key question is which input gives a constituent its influence. Price weighting uses the share quotation; capitalization weighting uses eligible equity value. A controlled example makes that difference visible, while the split example shows why a continuous index level can coexist with changing weights.
This explanation is general education, not financial advice.
Source documentation checked 11 October 2026. Educational explanation from the CrowdSent Blog Team. Numerical examples are hypothetical unless explicitly identified otherwise. This article does not provide investment recommendations.