

By CrowdSent Blog Team
PPI vs CPI is a comparison of different price perspectives. The US Producer Price Index follows domestic producers’ selling prices; the Consumer Price Index follows consumers’ purchase prices. A simple manufacturer–retailer example explains why their movements need not match.
PPI vs CPI starts with whose price is measured
In US data, the Producer Price Index measures changes in selling prices received by domestic producers. The Consumer Price Index measures changes in prices paid by consumers. The BLS overview of PPI makes the seller-versus-purchaser perspective explicit.
Those perspectives are related, but they do not trace one identical basket through a factory and then a shop. The PPI is a family of producer indexes. A headline final-demand PPI includes more than household purchases, while consumer inflation has its own coverage and weighting.
Begin by finishing two sentences: “This producer index covers sales of ___ to ___,” and “This consumer index covers purchases by ___.” If both blanks are reduced to “everything,” the PPI vs CPI comparison is too broad to support a precise explanation.
This article uses US definitions because PPI and CPI frequently appear together in international economic coverage. Readers in India and Pakistan should check domestic statistical definitions separately. Similar acronyms do not establish identical coverage across countries.
The task here is to identify the priced transaction. A producer’s selling price, a distributor’s margin, and a household’s final payment can move differently even when they concern the same physical item.
Final demand includes several kinds of buyer
The BLS PPI questions and answers explains that final demand covers goods, services, and construction sold for personal consumption, capital investment, government purchases, and exports. Intermediate demand concerns inputs used in production, with its own classification rules.
That makes “final demand” wider than “what families buy.” A machine acquired for capital investment and a product sold abroad can belong to final demand without appearing in the US household shopping basket.
Use a simple sorting exercise. Imagine four domestic producers: one sells bread for household consumption, one sells equipment for investment, one provides a service purchased by government, and one exports a product. All four sales can be relevant to the broad final-demand concept. An explanation focused only on the bread leaves most of that scope unexamined.
The sorting question is the intended final use in the statistical framework, not merely whether the invoice passed through a wholesaler. Avoid classifying an item as intermediate demand solely because a business handled it on the way to a household.
When comparing with CPI, inspect the PPI category most relevant to the claim. A producer series for one commodity and the all-items consumer index have different breadth. Their numerical difference is not a directly measured “retail markup.”
Imports and distribution change the comparison
BLS’s comparison of personal-consumption PPI and CPI identifies important boundary differences. Consumer prices can include imported products, while PPI’s domestic-production scope excludes import prices themselves. Consumer goods prices also incorporate distribution elements that producer statistics can measure separately.
Consider an imported household appliance. Its consumer price can be relevant to CPI. The appliance’s foreign producer price does not become a US domestic-producer price because the appliance is sold in a US shop. Domestic distribution services can still be a separate measurement question.
This distinction prevents a common overstatement: “PPI excludes imports, so no domestic activity connected to imported goods can appear anywhere in PPI.” The first part concerns the output boundary; the second wrongly extends it to every related service.
Taxes and other transaction details can also separate a purchaser’s payment from a seller’s receipt. Rather than forcing two indexes to match, list the conceptual differences before discussing the observed rates.
A useful comparison record therefore keeps the series name, producer or purchaser perspective, domestic or imported coverage, type of buyer, and component definition. That description often explains more than a chart placing two percentages beside each other.
PPI vs CPI example: the producer price rises while the shelf price stays flat
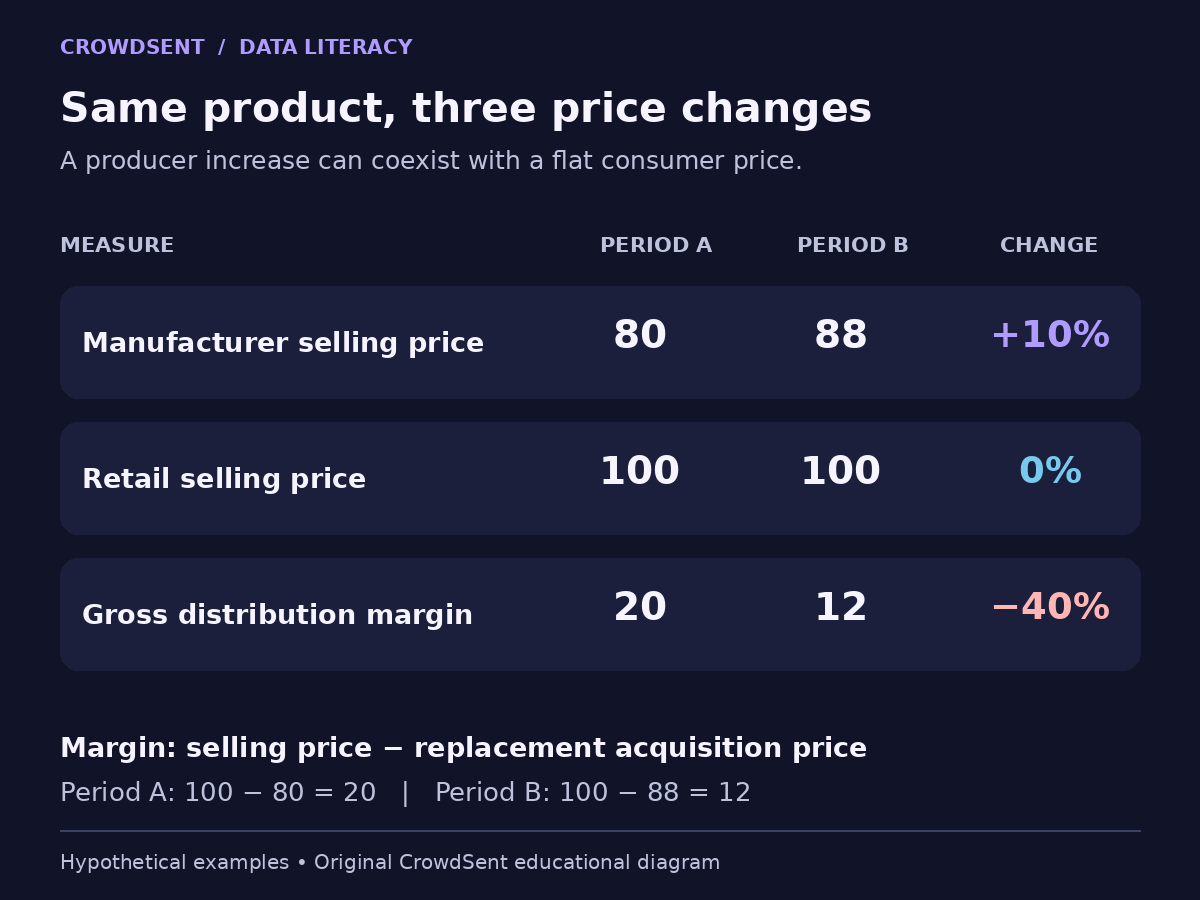
Imagine a retailer buying an unchanged product from a domestic manufacturer for 80 currency units and selling it to a household for 100. Ignore taxes, delivery charges, discounts, and other changes. The gross distribution margin is 100 − 80 = 20.
In the next period, the manufacturer’s selling price and the retailer’s replacement acquisition price rise to 88. The retailer keeps the retail selling price at 100. Three separate changes now appear:
- Manufacturer selling price: 80 to 88, an increase of 10%.
- Retail selling price: 100 to 100, a change of 0%.
- Gross distribution margin: 20 to 12, a decline of 40%.
The percentages differ because each has its own measured object and denominator. The manufacturer change is 8 ÷ 80. The margin change is −8 ÷ 20. The consumer price has no change.
This is a transaction illustration, not a calculation of official PPI or CPI. Each official index combines many observations under its own methods. It shows why “producer up 10%” does not logically require “consumer up 10%” for the same period.
The margin distinction has a specific statistical counterpart. In its guide to PPI misconceptions, BLS explains that wholesale and retail trade PPIs measure changes in gross margins, defined using selling prices and replacement acquisition prices, rather than the shelf-price change itself.
Our margin of 12 is not a statement of the retailer’s net profit. Operating expenses and other costs have not been deducted. Calling a trade-services margin index a complete profit index would add an unsupported interpretation.
Test a different pricing response before assuming pass-through
Now change only the second-period consumer price. Suppose the retailer sells the item for 108 after its acquisition price rises to 88. The gross margin remains 20. The consumer price increases 8%, while the manufacturer price still increases 10%.
The cash increase is eight units at both stages, yet the percentage increases differ. Eight divided by the original shelf price of 100 is 8%; eight divided by the original producer price of 80 is 10%. “Full pass-through in currency units” and “the same percentage change” are different descriptions.
A third possible shelf price is 104. The consumer price rises 4%, the manufacturer price rises 10%, and the gross margin falls from 20 to 16, or 20%. Again, the arithmetic is consistent.
These are alternative hypothetical responses, not forecasts of retailer behaviour. A real explanation would need evidence about the relevant product, contracts, timing, competition, and other costs. The broad PPI headline cannot identify those facts by itself.
It also cannot reveal a fixed lag before CPI must repeat its move. To investigate pass-through, first identify comparable categories and the proposed mechanism. Then choose a time window and method. Starting with the claim that one whole index automatically becomes the other skips those necessary steps.
Read category detail without creating a false total
Within a producer release, components can point in different directions. Use another invented classroom index, with a fixed 40% weight on goods and 60% on services. If goods rise 2% and services fall 1%, the simple weighted change is 0.40 × 2% + 0.60 × (−1%) = 0.2%.
The small total hides larger offsetting movements. It would be incorrect to conclude that every category rose about 0.2%. It would also be incorrect to add 2% and −1% without weights and call the result the aggregate.
This two-component fixed-weight example demonstrates aggregation only. Actual PPI structures, relative weights, and calculation conventions must come from the official table. Do not use the invented 40/60 split to reconstruct a release.
Check whether categories overlap. A broad services total and a trade-services subcategory are not independent pieces to add together. Show a parent category and its detail as separate levels of explanation.
Finally, preserve the full label of an exclusion measure. A series excluding food and energy has a different boundary from one excluding food, energy, and trade services. Shortening both to “core PPI” can conceal the difference that matters most to the comparison.
A practical reading sequence for a PPI headline
First identify the country, publisher, exact series, reference month, and comparison interval. Then check seasonal adjustment and whether the value has been revised. Only after those labels are aligned should you compare it with another index.
Next, identify the components doing the work. Ask whether the reported movement comes from goods prices, a service price, or a margin measure. Where the source gives contributions, use those rather than inferring importance from the largest percentage change.
If a post says the result “guarantees” a later consumer-inflation reading, trace the evidence using the market-news verification guide. A producer-price observation and a forecast about consumer prices should occupy separate sentences.
Leave unavailable component values blank. The guide to missing data versus zero explains why a missing observation cannot be silently treated as no price change.
For a concise research journal entry, record the observed PPI movement, the category definition, and the uncertainty in any comparison with CPI. A good summary preserves both transaction perspectives without forcing them into a single number.
PPI vs CPI: frequently asked questions
What is the main difference between PPI and CPI?
For US data, PPI takes the domestic seller’s perspective, while CPI takes the consumer purchaser’s perspective. Their coverage and weighting differ. They are related price measures, but they do not represent identical baskets at two consecutive checkout points.
Does final-demand PPI cover only consumer purchases?
No. Its scope also includes capital investment, government purchases, and exports. Check the detailed category when a claim concerns households specifically. The broad final-demand number includes several kinds of final use.
Is PPI simply the cost of raw materials?
No. The PPI family covers much more than raw materials, including services and construction. A particular input series can answer a narrower question, but it should not be used as the definition of every producer-price index.
Can PPI rise while CPI is unchanged?
Yes. Their different boundaries already allow divergence. Our product example also shows a manufacturer price rising from 80 to 88 while the consumer price stays at 100. It illustrates a possibility, not the behaviour of an entire official index.
What does a retail trade-services PPI measure?
It measures changes in gross distribution margins under PPI methodology. That is distinct from the household’s shelf-price change. In the example, a flat shelf price accompanies a margin decline from 20 to 12.
Is a gross trade margin the retailer’s net profit?
No. Our margin subtracts acquisition cost from selling price, while net profit would require other revenues and expenses. A 40% margin decline in the example does not establish a 40% decline in net profit.
Why can equal cash increases produce different percentage changes?
The denominators differ. An eight-unit increase from 80 is 10%; an eight-unit increase from 100 is 8%. A claim about pass-through should state whether it means equal currency amounts or equal percentages.
Are imported consumer goods part of US domestic-producer output?
The imported product’s foreign production is outside that domestic-output boundary. It can still enter consumer-price measurement, and domestic distribution services are a separate question. Avoid extending the import exclusion to every related domestic service.
Can I subtract CPI inflation from PPI inflation to estimate margins?
That difference compares aggregate rates with different coverage and weights. It does not recover a distributor’s margin. The worked margin example requires actual selling and replacement acquisition prices for the same product and period.
Does a PPI release predict the next CPI number exactly?
No exact mapping follows from the definitions. A forecast needs a separate method and evidence about relevant categories and timing. Keep the observed producer result separate from any claim about future consumer prices.
Educational information only. All worked-example figures are hypothetical and do not describe current market conditions. This article does not provide financial advice or forecasts.