

Earnings yield divides earnings per share by share price, usually expressing the result as a percentage. The price-to-earnings ratio, or PE, reverses those inputs. With the same positive earnings figure and price, the two measures describe the same relationship in different forms.
The useful work happens before division: choose the earnings period, identify whether EPS is reported or adjusted, and match it to a price observation. A clean-looking ratio can still compare unlike inputs. This guide shows the arithmetic and the interpretation limits using fictional companies.
Convert between a PE ratio and earnings yield
Assume Elm has a share price of USD 50 and annual diluted EPS of USD 4. Its PE ratio is 50 ÷ 4 = 12.5 times. Its earnings yield is 4 ÷ 50 = 0.08, or 8%. The percentage sign matters: the decimal yield is 0.08, not 8.
To convert a positive PE to earnings yield, calculate 1 ÷ PE and multiply by 100 to express the answer as a percentage. Thus 1 ÷ 12.5 = 0.08 = 8%. Going back, 1 ÷ 0.08 = 12.5. Dividing 1 by the displayed number 8 would produce an incorrect 0.125-times PE.
CFA Institute’s overview of market-based valuation identifies earnings yield as the reciprocal of PE and distinguishes historical from forecast earnings bases. The reciprocal relationship only works when the price and earnings inputs match. A trailing PE and a forward earnings yield need not invert.
For a quick comparison, 10-times PE corresponds to a 10% earnings yield; 20 times corresponds to 5%; and 25 times corresponds to 4%. These are mathematical conversions, not ratings of the businesses. They say how much chosen earnings sits behind a given price.
Specify which earnings you are dividing
“Annual EPS” can refer to the last completed financial year, the latest four quarters, the next financial year’s forecast or a rolling next-12-month forecast. Those periods may differ materially. A fiscal year ending in March also has a different boundary from a calendar year ending in December.
Suppose Elm’s latest completed annual EPS is USD 4, while a clearly labelled forecast for the next year is USD 5. At the same USD 50 price, the historical PE is 12.5 times and the forecast PE is 10 times. Historical earnings yield is 8%, while forecast earnings yield is 10%.
The forecast-based number assumes the projected earnings. It does not establish that Elm has already earned USD 5 per share. If the forecast later falls to USD 3 with the price unchanged, forward PE becomes about 16.67 times and forward earnings yield becomes 6%. The price has not moved; the expected earnings input has.
Reported and adjusted EPS require another distinction. If a release reports EPS of USD 4 and adjusted EPS of USD 6, the price produces different ratios even for the same period. Identify the excluded items and use the reconciliation. A bigger earnings denominator mechanically lowers PE; that alone does not validate the adjustment.
A price move and an earnings move can look alike
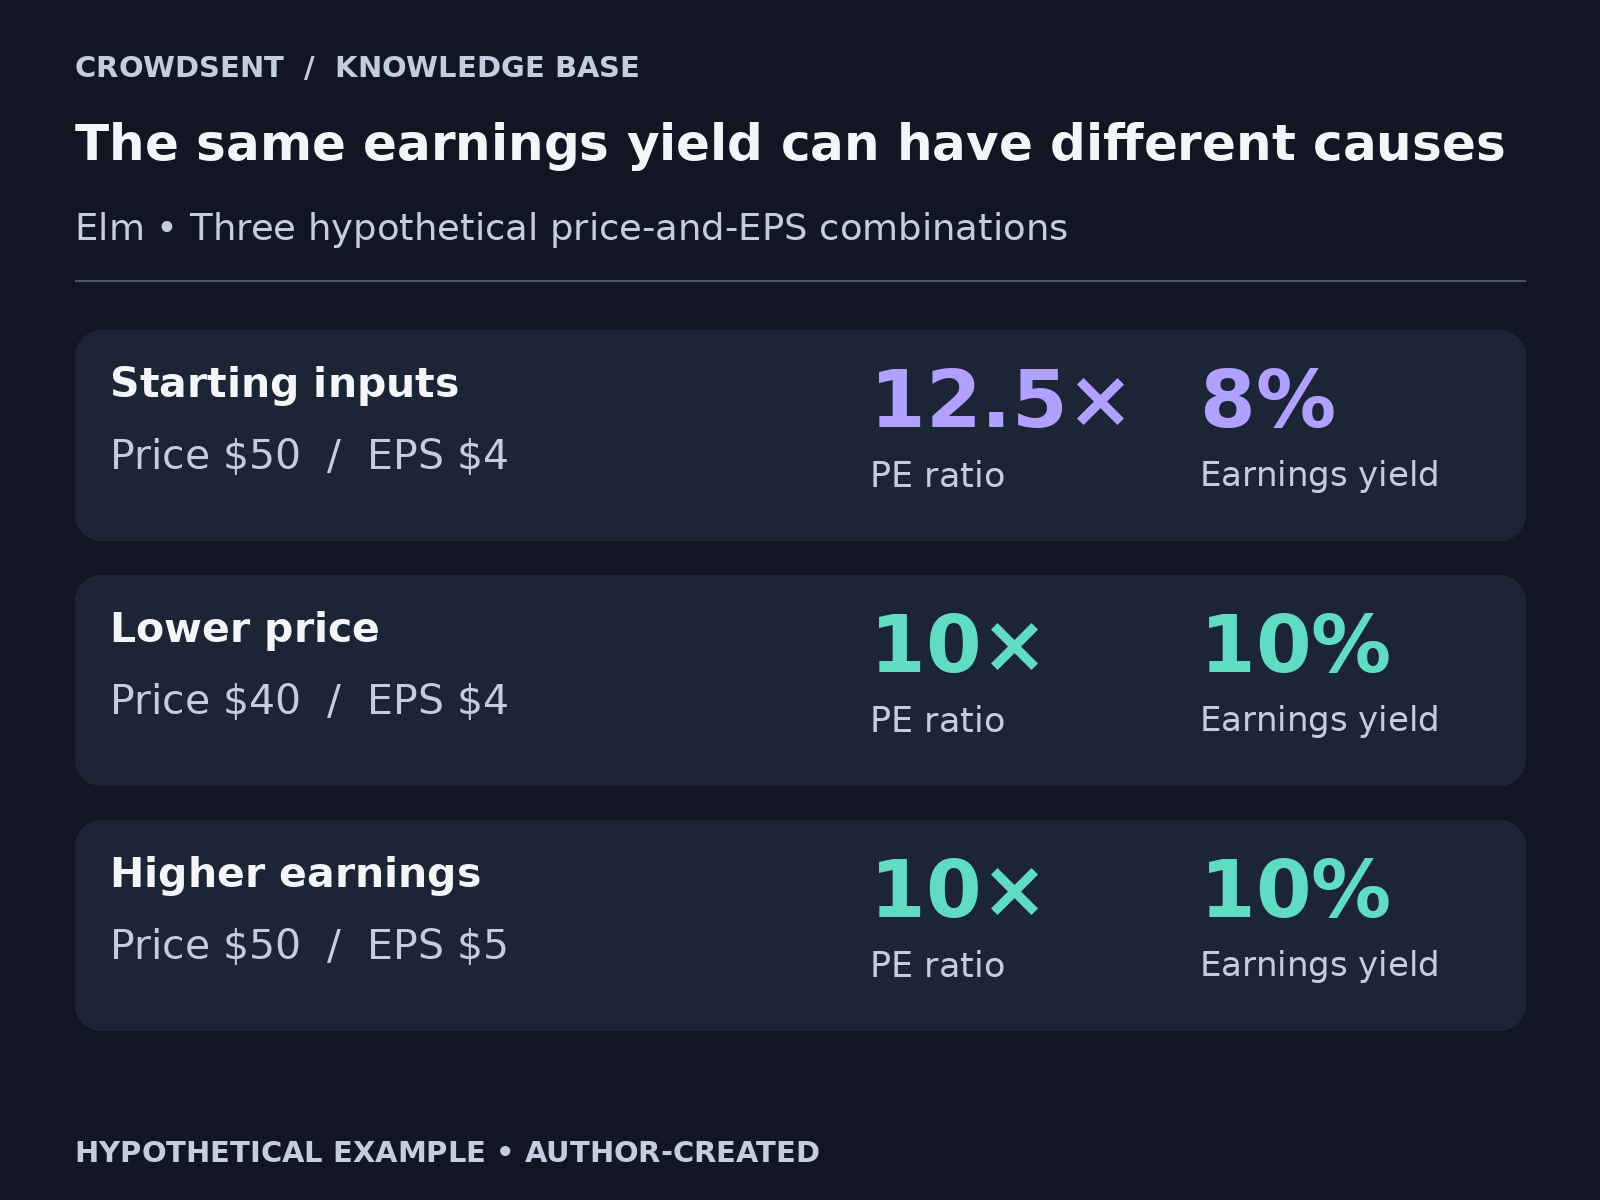
Keep Elm’s EPS at USD 4 and let its hypothetical price fall from USD 50 to USD 40. PE falls from 12.5 to 10 times, while earnings yield rises from 8% to 10%. The change is entirely in the price numerator for PE and denominator for earnings yield.
Now hold price at USD 50 and increase EPS from USD 4 to USD 5. PE also falls to 10 times and earnings yield also rises to 10%. The identical final ratios come from a different event: stronger earnings rather than a lower price.
A third case combines both movements. If price rises to USD 60 and EPS rises to USD 5, PE becomes 12 times and yield becomes approximately 8.33%. Price is 20% higher and earnings are 25% higher, so earnings grow slightly faster than price. The ratio records their combined effect.
Before explaining a change, save both inputs at both dates. A headline saying “valuation fell” is incomplete when it does not specify whether the underlying earnings are historical, newly forecast or restated. Trace any earnings update using the market-news verification checklist.
Earnings yield is not the cash yield paid to a holder
Suppose Elm earns USD 4 per share, pays a USD 1 dividend and has a USD 50 reference price. Earnings yield is 8%; the simple annual dividend-to-price calculation is 2%. These amounts coexist because accounting earnings and cash distributions are different measures.
The company might retain earnings, spend on assets, repay obligations or have differences between profit and operating cash flow. The earnings-yield equation does not specify those uses. It also contains no forecast of the price at which a shareholder could later sell.
Consequently, an 8% earnings yield is not a promised 8% holding-period return. For example, a holder buying at USD 50, receiving USD 1 and later selling at USD 45 has a simple pre-cost total return of (45 − 50 + 1) ÷ 50 = −8%. This outcome can coexist with the initial historical 8% earnings yield.
Comparing earnings yield with a bond yield requires care for the same reason. The percentages summarise different claims and assumptions. The equality of two displayed percentages does not make their cash flows, risks or contractual rights equivalent.
Handle zero, negative and unusually small earnings explicitly
At a USD 50 price and zero EPS, PE is undefined because its denominator is zero. Earnings yield is 0 ÷ 50 = 0%. A provider may display a dash or “not meaningful” for PE. Do not convert that missing or undefined field to a zero-times multiple.
If EPS is negative USD 2, arithmetic gives a PE of negative 25 and an earnings yield of negative 4%. A negative PE does not fit ordinary cheap-to-expensive rankings of profitable companies. The negative earnings yield expresses the loss relative to price, while the reasons for the loss still require investigation.
Even positive EPS can create an unstable ratio when it is very small. At USD 50 and EPS of USD 0.10, PE is 500 times. Increasing EPS by just USD 0.10 halves that PE to 250 times, although earnings yield changes only from 0.2% to 0.4%. Keep the underlying amounts beside the ratios.
The guide to missing market data versus zero explains the general distinction between an observed zero, an absent input and an undefined calculation. That distinction is especially important for companies near break-even.
Compare companies and baskets on a consistent basis
Imagine another fictional company, Fir, with a USD 20 price and USD 1 EPS. Its PE is 20 times and its earnings yield is 5%. Elm’s USD 50 share price is higher, yet its 12.5-times PE is lower. The unit share price alone cannot settle the earnings comparison.
Business mix, debt, cyclicality and the sustainability of the chosen earnings still matter. A one-off gain or temporarily strong profit year can make a historical multiple look low. The comparison needs an explanation of the earnings being used, rather than a universal numerical cutoff.
For a basket, aggregation introduces a separate calculation. Suppose two companies have equal USD 100 million market values and matched annual common earnings of USD 10 million and USD 5 million. Their individual PEs are 10 and 20 times. The aggregate market-value-to-earnings ratio is 200 ÷ 15 = about 13.33 times, not the simple average of 15 times.
Aggregate earnings yield is 15 ÷ 200 = 7.5%, which is also the equal-market-value-weighted average of 10% and 5%. Actual index providers can apply their own loss-company and weighting rules, so inspect the methodology before reproducing a published index ratio.
Finally, attach availability dates to historical inputs. Using earnings published in April to describe what was knowable in February introduces future information. A dated research record should retain price time, EPS period, publication date, calculation basis and any remaining uncertainty.
To explore a broader research workflow, read the CrowdSent platform overview. Keep the ratio’s calculation separate from any interpretation of how market participants are discussing it.
Frequently asked questions
Is earnings yield just the inverse of PE?
Yes, when both use the same nonzero earnings and positive price. Use the decimal yield in the inverse: 1 divided by 0.05 gives a 20-times PE. If one measure uses forecast EPS and the other historical EPS, the displayed values need not be reciprocals.
Does a higher earnings yield mean a better investment?
It means more of the selected earnings per unit of price. It does not resolve whether those earnings are sustainable or comparable, or what risks affect the company. The equation provides a defined comparison that still needs a business and accounting explanation.
Does PE tell me how many years it takes to recover my money?
Only under restrictive assumptions that the ratio itself does not establish, including unchanged earnings and full distribution. Real earnings, reinvestment, payouts and prices can change. A 12.5-times PE is a price-to-earnings relationship, not a contractual payback schedule.
Should I use basic or diluted EPS?
Use a stated basis and keep it consistent across the comparison. Diluted EPS considers qualifying potential share claims, while basic EPS uses the basic weighted-average denominator. Check the source’s label rather than assuming a data provider always chooses the same version.
What if the price and EPS are in different currencies?
Convert them to a compatible per-share currency basis before dividing, and document the conversion convention. Also check whether an ADR represents multiple ordinary shares. A currency or share-unit mismatch can produce a plausible-looking ratio with no coherent meaning.
Why do two services show different PE ratios?
They may use different prices, earnings periods, forecast sets, adjustments or share-class conventions. Record each definition and reproduce each result separately. Do not assume that a more recently refreshed webpage necessarily contains more recently reported earnings.
Can a stock split change the economic earnings yield?
A pure split changes the share unit. If price and EPS are adjusted consistently, their ratio is unchanged. A two-for-one split halves both a USD 50 price and USD 4 EPS to USD 25 and USD 2, preserving the 8% yield.
How should I record negative earnings yield?
Keep the negative sign and label the earnings period and basis. For EPS of negative USD 2 and price of USD 50, the yield is negative 4%. It describes a loss relative to price; it is not a promised negative shareholder return.
Can I average company PEs to get an index PE?
A simple average generally differs from aggregate market value divided by aggregate earnings. Provider rules can also exclude or treat loss-makers specially. Use the index’s stated aggregation method and weights, preserving any differences from your own illustrative calculation.
What is the smallest useful comparison record?
Save the security and share unit, price and timestamp, EPS and period, publication date, basic or diluted label, reported or adjusted basis, and whether earnings are actual or forecast. Those fields make both PE and earnings yield reproducible.
Educational examples only. The companies and figures in the worked examples are fictional and are not investment recommendations.