

By CrowdSent Blog Team
PCE vs CPI compares two US consumer-price measures with different coverage, weights, and calculation methods. Neither headline can explain the gap alone. Two fictional baskets show how the same category prices can produce different aggregate inflation rates.
PCE vs CPI: different views of consumer prices
In US economic releases, CPI is produced by the Bureau of Labor Statistics and the PCE price index by the Bureau of Economic Analysis. Both measure consumer-price change, but the populations, spending boundaries, relative weights, and index construction differ.
The BEA description of the PCE price index explains that it covers prices of goods and services purchased by people in the United States or on their behalf. Monthly PCE price information appears in the Personal Income and Outlays report.
For CPI, identify the version. In this guide, the comparison is with the widely reported all-items CPI for All Urban Consumers, or CPI-U. A different CPI variant can change the methodological comparison.
Keep “PCE spending” separate from “PCE price index.” A money total spent on consumption can change because of quantities, prices, or composition. The price index is specifically intended to measure price change. A headline about spending growth cannot simply be renamed PCE inflation.
For readers in India and Pakistan, these remain US statistical measures. Their presence in global market coverage does not make either index a measurement of domestic household inflation.
Who pays is part of the coverage question
BEA’s PCE–CPI comparison groups differences into formula, weight, scope, and other effects. A central scope distinction is that PCE includes spending by and on behalf of households and nonprofit institutions serving them, whereas CPI focuses on households’ out-of-pocket expenditure within its framework.
A healthcare example helps illustrate the question without reproducing either index. Suppose a service costs 100 units, with a household paying 20 and another payer covering 80. “What did the household directly pay?” and “What was spent on the service for the household?” refer to different amounts.
If the household’s contribution changes, that does not necessarily identify the change in the service’s total price. Conversely, a change in total expenditure need not be a change of the same size in the household’s direct bill. Actual healthcare index methods require more detail than this two-payer sketch.
The lesson is about boundaries, not which payer’s amount is universally better. A question about a household payment and a question about broader consumption can reasonably call for different measurements.
When reading a claim that one index “missed” an expense, first check whether the expense falls within its intended scope. Coverage differences should be described explicitly before they are treated as a measurement error.
Worked example: identical price changes, different inflation rates
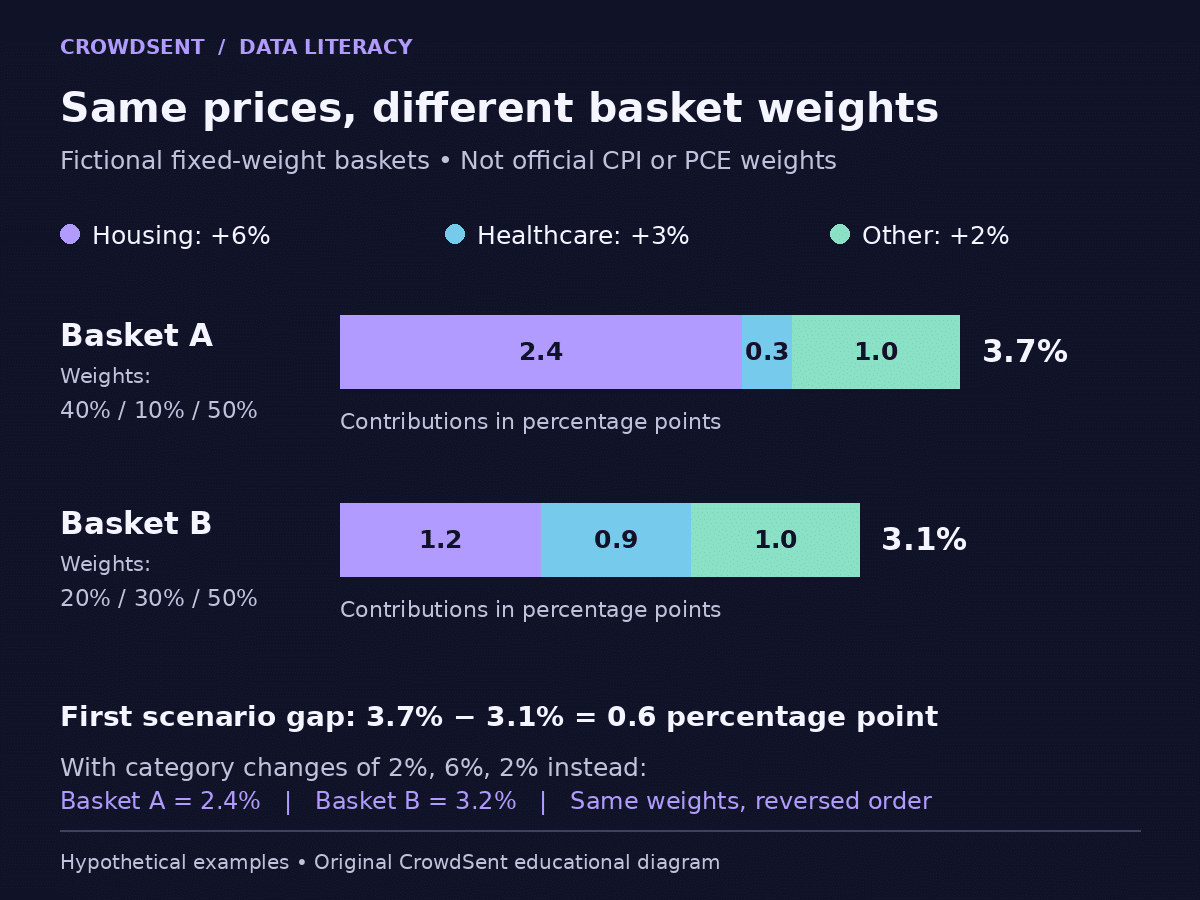
Build two fictional fixed-weight baskets using the same three category price changes. Housing rises 6%, healthcare rises 3%, and other purchases rise 2%. Every category starts at an index level of 100. There are no quality changes or additional complications in this exercise.
Basket A assigns 40% to housing, 10% to healthcare, and 50% to other purchases. Its weighted change is:
0.40 × 6% + 0.10 × 3% + 0.50 × 2% = 2.4% + 0.3% + 1.0% = 3.7%.
Basket B assigns 20% to housing, 30% to healthcare, and the same 50% to other purchases. Its weighted change is:
0.20 × 6% + 0.30 × 3% + 0.50 × 2% = 1.2% + 0.9% + 1.0% = 3.1%.
The category prices are identical in both calculations. Only the weights differ. The totals nevertheless differ by 0.6 percentage point. At a common starting index of 100, the ending levels are 103.7 and 103.1.
These are invented baskets, not actual CPI and PCE weights and not reproductions of their full formulas. Their purpose is narrower: different inflation totals do not require different observations for every underlying price.
The contributions also explain the gap. Basket A’s extra 20-percentage-point housing weight adds 1.2 percentage points relative to B. Its 20-percentage-point lower healthcare weight subtracts 0.6. The other category contributes no difference, leaving a net gap of 0.6.
Changing the category pattern can reverse the ordering
Keep both fictional baskets’ weights unchanged, but use a new price scenario: housing rises 2%, healthcare rises 6%, and other purchases rise 2%.
Basket A now records 0.40 × 2% + 0.10 × 6% + 0.50 × 2% = 2.4%. Basket B records 0.20 × 2% + 0.30 × 6% + 0.50 × 2% = 3.2%. The basket with the lower inflation rate in the first scenario now has the higher rate.
The reversal comes entirely from which category has the strongest price increase. There is no permanent ordering built into this arithmetic. A rule such as “subtract a fixed amount from CPI to get PCE” therefore needs evidence that the actual statistics do not promise by definition.
For a real release, use current component information and the publisher’s analysis. Our 0.6-point gap is not an adjustment factor to apply to a news headline. Even the same hypothetical weights produce a different gap when the category rates change.
This exercise also cautions against explaining an aggregate difference with one category alone. A category can create a positive contribution while another offsets it. The net result needs the whole relevant comparison.
Formula differences go beyond a permanently fixed basket
At the aggregate level, BEA describes PCE’s formula as Fisher-Ideal and CPI’s as modified Laspeyres. The practical implication is that the two systems combine price and spending information differently. The simple weighted calculations above isolate one mechanism; they do not implement either full system.
Avoid the common shortcut that CPI makes no allowance at all for consumer substitution. The BLS CPI questions and answers explains that most basic CPI indexes use a geometric-mean formula that permits some substitution within categories. Chained CPI is another distinct series.
That detail matters when reading an explanation built around a shopper switching products. Ask whether it concerns substitutions within a category, movements across broad categories, an update to expenditure weights, or an entirely different CPI variant. These are not interchangeable claims.
You do not need to rebuild both indexes to interpret a release responsibly. You do need to avoid describing one as a frozen list that can never change and the other as a perfect account of every household’s choices.
For a technical comparison, consult the official reconciliation rather than inferring the formula effect from the headline gap alone. Our toy baskets demonstrated a weight effect without changing the formula at all.
Why PCE appears in Federal Reserve discussions
The Federal Reserve’s inflation FAQ identifies the longer-run 2% inflation objective in terms of the PCE price index. It also says policymakers examine other price measures, component detail, and core measures when assessing inflation.
That distinction prevents two common reading errors. The target’s named index should not be silently replaced by CPI, and attention to PCE should not be described as ignoring CPI entirely. Different releases can contribute evidence to the same broader assessment.
Keep headline and core consistent when comparing the two systems. A headline CPI reading beside a core PCE reading changes both the index family and the exclusion rule. If that is the intended comparison, say so; if the question is about index construction, align the coverage first.
A single inflation number does not contain a policy decision. When a headline connects an inflation reading to a future action, check what officials actually published. The guide to FOMC statements and minutes helps distinguish source documents from commentary about their implications.
Build a like-for-like comparison note
Start with two full labels, such as all-items CPI-U and the all-items PCE price index. Record the country, reference month, monthly or twelve-month change, seasonal-adjustment basis, source, and retrieval date for each.
Separate the reference month from publication day. An article published later can still describe the same month as an earlier release. Aligning the publication dates while leaving the reference months different creates a false same-period comparison.
Use the precision supplied by the source. Suppose two hypothetical rates both round to 0.2% at one decimal place. They might have been 0.16% and 0.24% before rounding. A matching headline display does not establish identical underlying price change.
If you want to explain a gap, list the possible sources of difference: scope, weights, formula, and other methodological effects. Then identify which ones you have actually established. Do not turn a plausible explanation into a measured contribution without the relevant data.
Use the market-news verification guide to trace claims to their original tables. Save the paired labels and your calculation in a research journal. A useful conclusion can be modest: “The rates differ over the same interval, and the indexes use different coverage and weights; this headline alone does not quantify each effect.”
Frequently asked questions
What is the main difference between PCE and CPI inflation?
Both concern consumer prices, but they use different coverage, weights, and construction. PCE includes spending on households’ behalf as well as spending by them. Specify which CPI variant and which PCE measure you are comparing.
Does a rise in PCE spending mean the same rise in PCE inflation?
No. Spending is a money amount and can change with quantities, prices, or composition. The PCE price index measures price change. Keep the spending total and the inflation measure in separate fields.
Can different weights alone change an inflation total?
Yes. Our first fictional example uses identical category increases in both baskets but produces 3.7% and 3.1%. The 0.6-percentage-point difference arises entirely from weights under the example’s fixed-weight formula.
Are the example’s housing and healthcare weights official?
No. Every weight and price change in the worked example is invented. The example demonstrates aggregation without representing current CPI or PCE data. Use the official tables for actual category weights and contributions.
Must PCE inflation always be lower than CPI inflation?
There is no universal ordering established by their definitions. In the fictional baskets, changing which category rises fastest reverses the order. Actual comparisons depend on the period and the combination of methodological effects.
Does CPI ignore every form of consumer substitution?
No. BLS describes a geometric-mean approach for most basic CPI indexes that permits some within-category substitution. Broad claims about a completely fixed basket miss that distinction. Chained CPI also needs its own label.
Which index is named in the Fed’s longer-run inflation goal?
The Federal Reserve names the PCE price index for its 2% longer-run objective. It also examines other inflation evidence. The named target does not make each PCE release a complete description of a policy decision.
Can I compare core PCE directly with headline CPI?
You can show both with explicit labels, but the comparison changes index family and excluded categories together. To focus on construction differences, align headline with headline or a clearly defined comparable exclusion measure first.
Can one constant adjustment convert CPI inflation into PCE inflation?
The definitions provide no fixed conversion. Scope, weights, formulas, and other effects can change the gap. Our second hypothetical scenario reverses the ranking even though both baskets retain their original weights.
Why do identical rounded monthly readings still need care?
Rounding can hide differences in underlying rates. The example of 0.16% and 0.24%, both displayed as 0.2%, shows why matching one-decimal headlines need not mean identical observations. Preserve the available precision and exact series labels.
Educational information only. All worked-example figures are hypothetical and do not describe current market conditions. This article does not provide financial advice or forecasts.