

By CrowdSent Blog Team
NFP meaning starts with a distinction: the US payroll report estimates jobs, not every employed person. Learn to read the new monthly estimate, earlier revisions, and the details behind the headline.
NFP meaning: the payroll jobs measure behind the headline
NFP stands for nonfarm payrolls. In market commentary, “the NFP number” usually means the monthly change in US total nonfarm payroll employment, reported by the Bureau of Labor Statistics through the Current Employment Statistics establishment survey. It is an estimate of payroll jobs, rather than a count of every person working in the country.
The establishment survey collects information from employers. Its scope includes covered private-sector and civilian government payroll employment. Farm employment, private-household workers, and unincorporated self-employment are outside the payroll series. The BLS CES frequently asked questions explain the coverage and reference period.
The label matters because a jobs headline often sits beside other figures from the Employment Situation report. Those figures can have different survey sources, populations, and units. Read the payroll line as its own statistic before combining it with a wider interpretation of the labor market.
An international reader should also keep the geography visible. This is a US employment measure. It can appear in discussions of currencies, commodities, or global economic conditions, but it does not count jobs in the reader’s home country.
Why payroll jobs and employed people are different counts
A person can hold two jobs at different establishments and appear in both payrolls. A separate household-based employment measure counts that person once. BLS explains the distinction in its comparison of household and payroll employment. The two measures also differ in coverage, so their monthly changes need not match.
Consider a hypothetical town with four people. One person works at a shop and a restaurant, while the other three each work at one covered establishment. There are five payroll jobs held by four people. If the first person leaves the restaurant but keeps the shop job, payroll employment falls by one job while the number of employed people stays unchanged.
Now imagine a resident starts an unincorporated solo business without adding a payroll job at a covered establishment. That activity does not automatically add one to the payroll series. A statement about “everyone who found work” therefore claims more than this particular statistic measures.
This distinction is sufficient for reading NFP. The unemployment rate has a separate definition and denominator; it should not be derived by simply subtracting the payroll change from a population count. Keeping the measures separate avoids creating a false accounting identity.
Read the reference period before the release date
Payroll employment generally counts employees who received pay for any part of the pay period containing the 12th of the reference month, including full- and part-time employees. That pay period can differ across employers. The statistic is not a census of everyone working on the last day of the month.
Suppose a hypothetical employer uses a two-week pay period that includes the 12th. A worker paid for part of that period can count even if they did not work every day. A dramatic event after the relevant pay period may not yet be reflected in the month’s employment count in the way a casual reader expects.
This creates three dates worth recording: the reference month, the reference-period convention, and the publication date. “The report released today” describes when the information became public. It does not mean that every underlying observation describes today’s labor market.
When an article links a payroll surprise to a very recent event, compare the chronology first. An explanation that occurs after the observations it supposedly caused needs closer scrutiny. CrowdSent’s guide to verifying market news provides a practical approach to checking that timeline.
A monthly change is a net estimate, not total hiring
If total payroll employment rises from a hypothetical 1,000,000 jobs to 1,120,000 jobs, the net change is +120,000. That does not tell you how many individual hires occurred. Many establishments may have added jobs while others shed jobs, and turnover can occur without changing the number of positions on payroll.
For example, a business can replace ten departing workers with ten new workers and show no change in its employment count. Another can hire ten workers into additional positions and show an increase of ten. A payroll employment change and a gross-hiring statistic describe different flows.
Seasonal adjustment is another part of the headline. BLS describes how recurring calendar patterns are addressed in its Employment Situation methods guide. Compare adjusted data with adjusted data; do not splice an unadjusted holiday-season change into an adjusted trend.
A hypothetical net gain of +100,000 can also hide different industry stories. One scenario has five sectors each adding 20,000. Another has one sector adding 160,000 while the rest together lose 60,000. The same aggregate gain can accompany broad expansion or a narrow concentration of growth.
Worked example: the new month and revisions tell one combined story
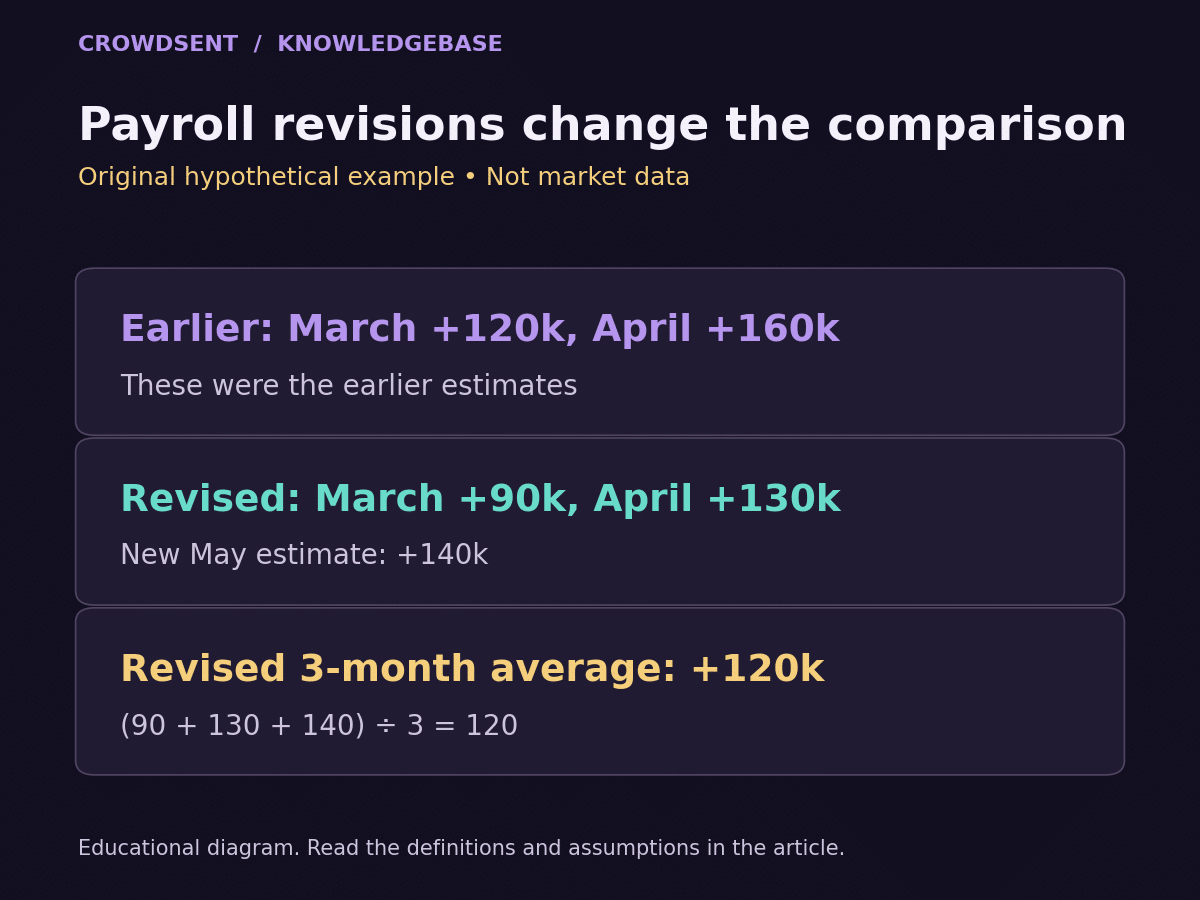
Imagine a release in which March had previously been reported at +120,000 and April at +160,000. The next release revises March to +90,000 and April to +130,000, while reporting a first estimate of +140,000 for May. All values in this example are hypothetical net monthly payroll changes.
The revisions are −30,000 for March and −30,000 for April, a combined −60,000. The updated three-month total is 90,000 + 130,000 + 140,000 = 360,000. Dividing by three gives an average gain of 120,000 jobs per month.
If you combine the old March and April figures with the new May figure, you get 420,000 and an average of 140,000. That calculation mixes release vintages and overstates the updated three-month total by 60,000. The arithmetic is easy; the difficult part is remembering to replace the earlier estimates.
Do not describe the −60,000 revision as 60,000 people being newly fired in May. It changes the estimate of earlier periods. Also, May’s +140,000 should remain labeled the current month’s estimate rather than being silently rewritten as +80,000 after subtracting revisions.
For this simplified example, a researcher might summarize the new information as +140,000 for May together with −60,000 in earlier revisions. If combining them into a single +80,000 arithmetic summary, label that construction explicitly. It is not the official May payroll change. The separate figures remain the clearest way to preserve which month each piece of evidence describes.
BLS publishes preliminary estimates followed by two monthly revisions and an annual benchmarking process. The initial release therefore provides an early estimate, not an immutable final count. Revision size and direction are useful evidence to examine; a revision alone does not explain its cause.
Read industry detail, hours, and earnings alongside the total
Industry breakdowns help show where changes are concentrated. Keep the categories consistent and avoid counting a broad industry total together with its own subcategories. Adding “manufacturing” and a manufacturing subindustry as though they were independent rows would double-count part of the same employment.
Hours and earnings provide additional context, but an average can move because the composition of jobs changes. Imagine two equally sized groups working the same hours, one earning 20 units per hour and the other 40. Their combined average is 30. If the lower-paid group becomes smaller, the average can rise even if nobody receives a pay increase.
The reverse can happen when more lower-paid jobs enter the sample. This arithmetic is why a change in average hourly earnings should not automatically be described as the raise received by a typical continuing worker. It is a different statistical question.
Similarly, an employment count does not summarize total labor input. A business with 100 workers averaging 35 hours has 3,500 worker-hours. If the headcount stays 100 and hours fall to 34, the count is unchanged while the simple total falls to 3,400. These classroom examples show why reading several dimensions can be more informative than one large headline.
Keep the data vintage and the forecast source in your notes
When reviewing an old market reaction, retrieve what was published at the time. BLS provides CES vintage data information for studying the sequence of estimates. The latest revised history is useful for present analysis, but it is not the exact information set available to readers of the first release.
If a headline says payrolls “beat expectations,” identify the forecast source and when that forecast was collected. A +140,000 result is above a +100,000 consensus and below a +180,000 consensus. The actual estimate has not changed; the benchmark for the word “beat” has.
Keep missing fields visible. An unavailable prior estimate is not zero, and an absent forecast does not mean that no jobs were expected. The same distinction appears in CrowdSent’s guide to missing data versus zero.
A concise research journal entry should include the new estimate, previous-month revisions, a consistently calculated recent average, major industry contributions, and the release vintage. Put any proposed explanation or market implication in a separate sentence so it cannot be mistaken for an official finding.
Frequently asked questions
What does NFP mean in an economic calendar?
It generally abbreviates US nonfarm payroll employment, often specifically its monthly change. Check whether the calendar displays the employment level or the change, and whether figures are in jobs, thousands, or millions. The short label alone does not settle the unit.
Does the payroll number include government jobs?
Total nonfarm payroll employment includes covered civilian government jobs as well as private-sector employment. A private-payroll figure has a narrower scope. Compare the exact series names rather than assuming every payroll headline refers to the same total.
Is one payroll job always one employed person?
No. A person with jobs at separate establishments can be counted in each payroll. The town example shows how one payroll job can disappear while that person remains employed elsewhere. Jobs and people should remain distinct units in the explanation.
Does NFP measure every new hire during the month?
No. The headline change is a net change in estimated payroll employment. Replacing a departing worker may create a hire without increasing the job count. Gross hiring, separations, and payroll levels are related but different measures.
Why do earlier payroll numbers change?
Estimates are updated as additional information becomes available and through scheduled statistical processes. Keep the initial release and subsequent estimates together when analyzing accuracy or past reactions. A changed estimate does not mean the underlying jobs all appeared or disappeared on revision day.
Should I subtract revisions from the current month’s number?
Report the current-month estimate and prior-period revisions separately first. A combined arithmetic summary can be useful only if clearly labeled. Subtracting revisions and calling the result the current month’s official payroll gain changes the meaning of the published statistic.
Can average earnings rise without widespread pay increases?
Yes. Changes in the mix of jobs or hours can move the aggregate average. The hypothetical 20- and 40-unit example demonstrates this without any individual receiving a raise. A claim about continuing workers’ pay needs evidence designed for that question.
Does a positive payroll change prove every industry is improving?
No. Gains in some industries can exceed losses elsewhere. Inspect the industry detail and compare several consistently defined periods. A positive aggregate is evidence about the total, not a guarantee that each component shares its direction.
Does a stronger NFP number guarantee a currency or gold move?
No. Interpretation depends on the broader information set, expectations, revisions, and many other influences. A payroll release supplies economic evidence, not a fixed instruction for an asset price. This article makes no directional market prediction.
What should I save when studying a payroll release later?
Save the original publication, reference month, seasonal-adjustment label, units, new estimate, revisions, and any separately sourced consensus forecast. These details let you reconstruct what was known then instead of accidentally judging an old reaction using today’s revised data.
Educational information only. Examples are hypothetical and are not forecasts, recommendations, or investment advice.