

By CrowdSent Blog Team
Natural gas storage data show how much gas is held within a defined storage system and how that quantity changes. For the U.S. weekly report, the central measure is working gas in underground storage in the Lower 48 states. It is a regional fuel-balance indicator with a specific geographic boundary.
Reading it well requires more than checking whether the weekly number is positive or negative. Separate the amount stored from storage capacity, distinguish a stock change from physical flow when adjustments occur, and compare the observation with both the season and a properly recorded expectation.
Working gas, base gas and capacity
Working gas is the stored volume above the base-gas level. Base gas, sometimes called cushion gas, is intended to help maintain reservoir pressure and withdrawal capability. Total inventory combines the categories, while working-gas capacity describes how much working gas a facility can hold under the relevant capacity definition.
These are separate quantities. A facility’s stated capacity is not the volume currently stored. A large inventory is not the same as an equally large quantity deliverable in a single day. EIA’s underground storage guide explains these distinctions and the role of deliverability, the rate at which gas can be withdrawn.
For a hypothetical facility with total capacity of 10 billion cubic feet and base gas of 4 billion, working-gas capacity would be 6 billion cubic feet under those assumptions. If current working inventory is 3 billion, it holds half that working capacity. Calling it “30% full” uses total capacity as the denominator and answers a different question.
The example also shows why a storage percentage needs a label. Before comparing two facilities or countries, identify which inventory and which capacity definition the percentage uses. A neat chart cannot correct mismatched denominators.
How to read the weekly natural gas storage report
EIA’s weekly estimates cover the Lower 48 states and five regions. Its storage-report methodology describes the survey and estimation process, the regional structure and published measures of sampling variability. The observations should therefore be read as estimates, with reporting notes and revisions retained.
Start with four fields: the reference date, working-gas level, weekly net change and unit. Bcf means billion cubic feet. A level of 3,000 Bcf is a quantity at a date; a weekly change of 60 Bcf is the difference over an interval. Neither is a daily flow rate.
Then read the historical comparison and any explanatory note. Do not detach a headline number from the geography or observation date. A release becomes available after the period it measures, so publication time and reference time should be stored separately in a research record.
The report’s national figure can also conceal regional differences. A build in one region can offset a draw elsewhere. If your question concerns a specific hub or demand region, inspect the relevant regional evidence rather than assuming the national total describes local availability.
Stock changes can include more than injections and withdrawals
Usually, a positive weekly change is discussed as a build and a negative change as a draw. But a stock series can also change because gas is reclassified between working and base categories. The EIA storage definitions and notes explicitly identify reclassifications as one source of reported stock changes.
Read the release’s treatment of non-flow adjustments before calling the entire difference a physical injection or withdrawal. When an implied-flow measure is provided, use its definition rather than assuming it is interchangeable with the change in working stocks.
This is a broader data-reading lesson: the arithmetic difference between two snapshots need not measure only the process you had in mind. A category boundary can move as well. Keep the explanatory note with the observation so that a later chart does not erase that context.
Worked example: level, weekly change and surprise
Suppose working gas was 3,000 Bcf at the previous observation and is 3,060 Bcf in a hypothetical new report. The weekly change is plus 60 Bcf. In this exercise, assume the report contains no reclassification or other non-flow adjustment.
Before publication, a recorded forecast expected an 80 Bcf build. The surprise is actual minus expected: 60 minus 80 equals minus 20 Bcf. Stocks increased, but the increase was 20 Bcf smaller than the saved expectation. A note that says simply “storage rose” leaves out that second comparison.
Now suppose the relevant five-year seasonal reference is 2,900 Bcf. The current level is 160 Bcf higher. Divide 160 by 2,900 and multiply by 100 to obtain approximately 5.52% above the reference. A smaller-than-expected build can therefore coexist with above-reference inventories.
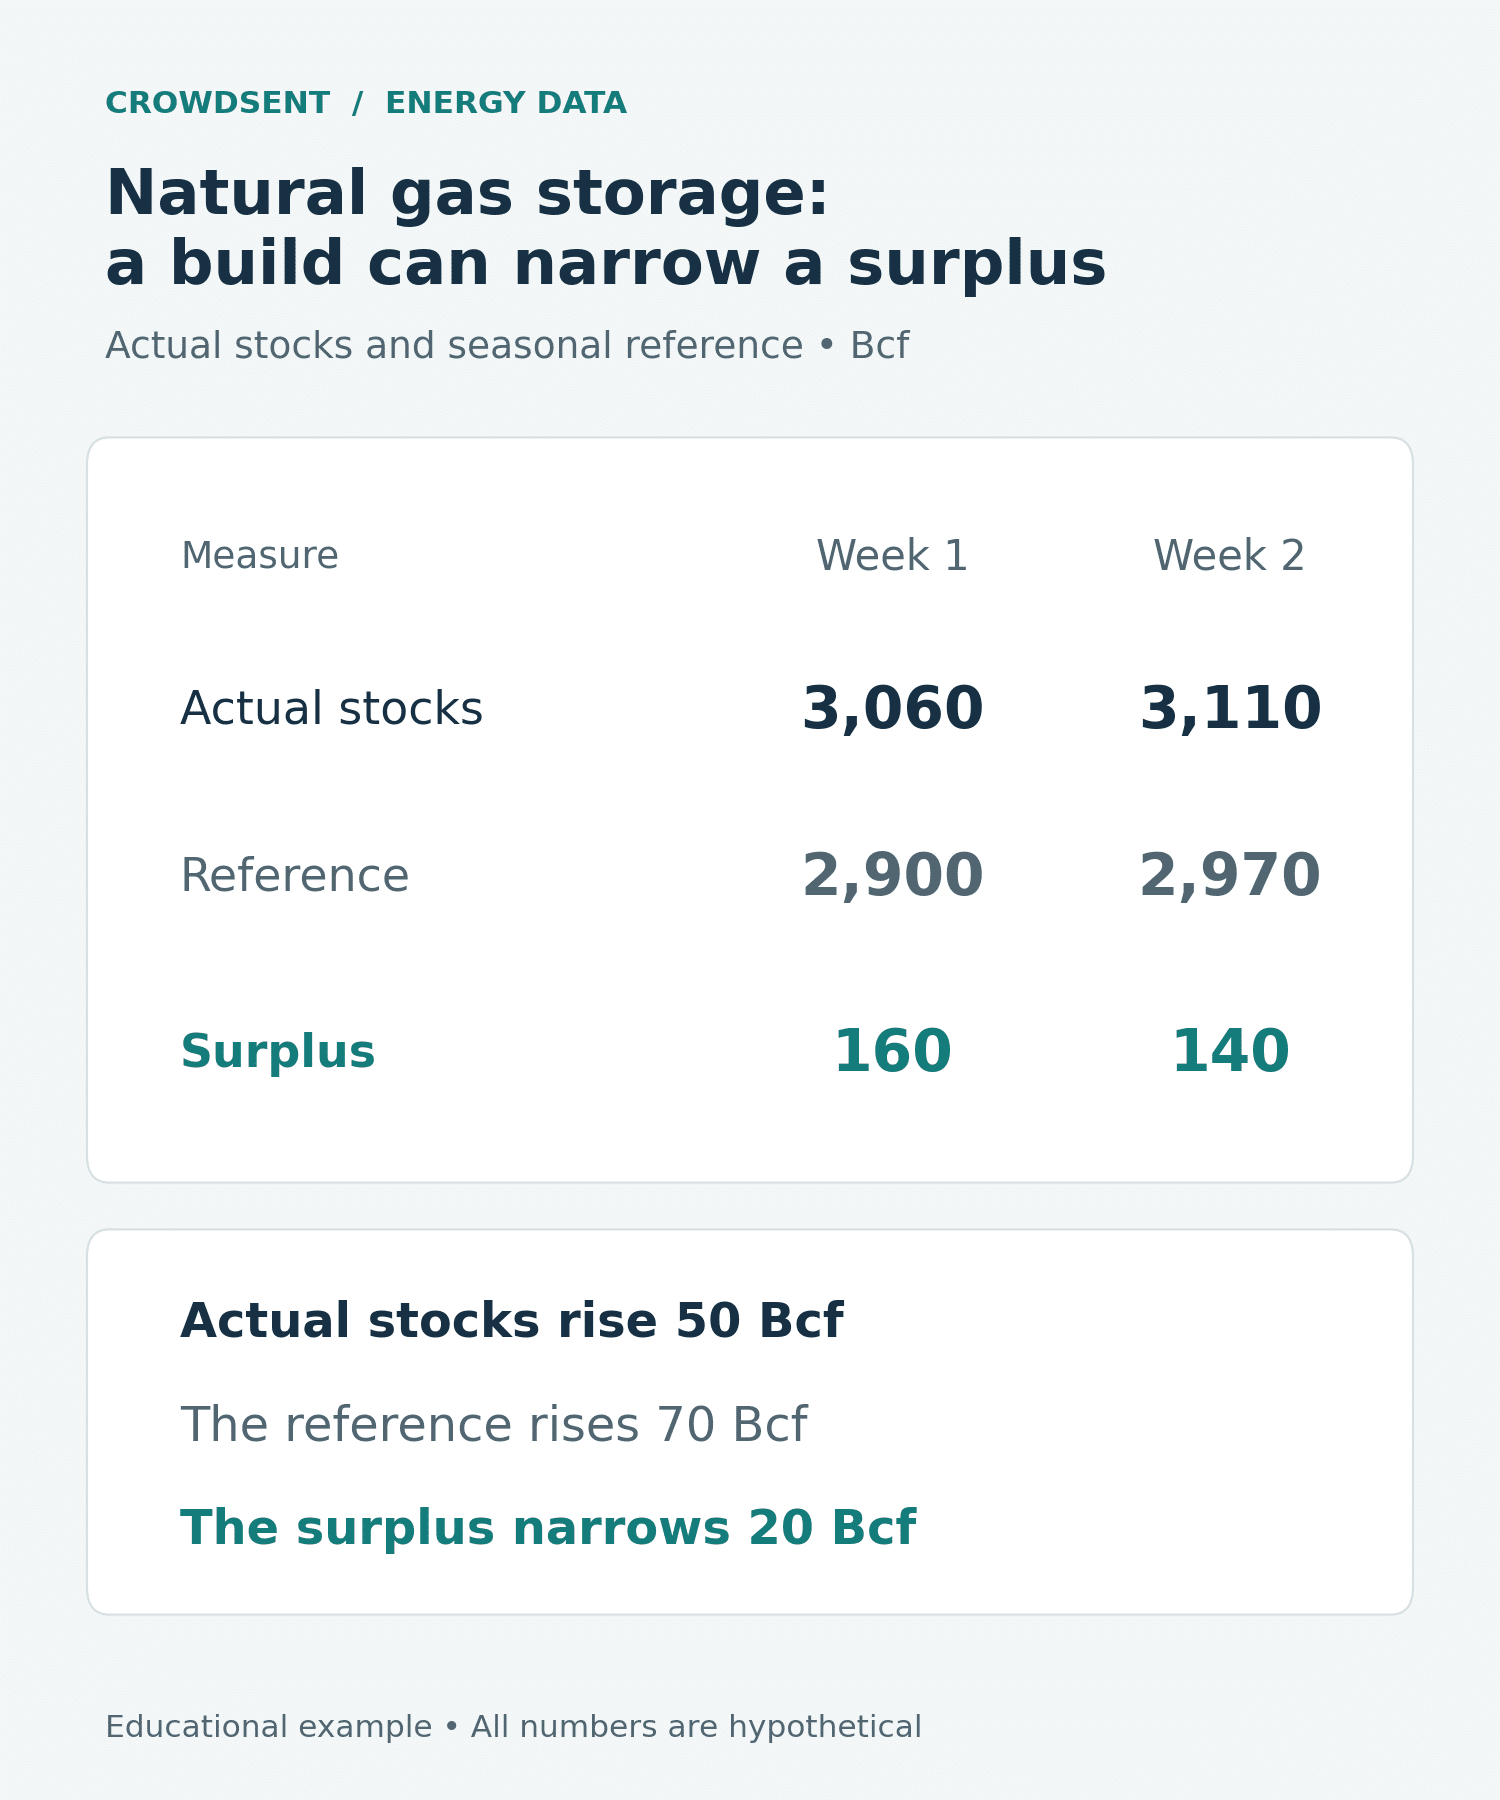
Add one more observation. Assume the following week’s working stocks reach 3,110 Bcf, while the comparable seasonal reference rises to 2,970 Bcf. Actual stocks built by another 50 Bcf, but the surplus to the reference narrowed from 160 Bcf to 140 Bcf because the reference rose faster.
That is a useful distinction: an increasing stock level does not necessarily mean an increasing seasonal surplus. Track the level and reference together instead of drawing a conclusion from the slope of only one line.
A separate example of reclassification
Imagine a simplified storage system that begins with 500 Bcf of working gas. Physical net injections add 50 Bcf, but 10 Bcf is reclassified from working gas to base gas. Ending working gas is 540 Bcf: 500 plus 50 minus 10.
The working-stock change is plus 40 Bcf, while physical net flow in this example is plus 50 Bcf. The difference is an accounting-category change, not gas disappearing. These invented figures illustrate why a release note can materially change the interpretation of a headline.
Why the season and weather matter
Natural gas demand has strong weather-related elements. Cold conditions can increase heating demand; hot conditions can increase electricity demand and gas use by power generators. EIA’s guide to natural gas price drivers also identifies production, imports, exports and storage as important supply-side factors.
That makes a seasonal comparison more useful than a simple comparison between unrelated parts of the year. A large withdrawal during a cold period should be examined alongside conditions during that same interval. An unusual build needs similar context about the balance of supply and use.
Do not treat a historical seasonal pattern as a schedule that every week must follow. Weather, operating conditions and the structure of demand can differ. A historical average is a reference for asking what changed, not a guarantee of what the present balance should be.
A weather-based explanation also needs geographic alignment. A temperature story about one region does not automatically explain the entire national change. Identify the relevant region, period and demand channel before attributing the result to weather.
Inventory availability is different from delivery capability
A storage level describes how much is held. Deliverability concerns how quickly it can be brought out and supplied through the relevant system. These questions become especially important when the research problem concerns a short, intense demand period.
Consider two hypothetical facilities each holding 100 units of usable inventory. If one can supply 10 units per day and the other only 2, equal inventories do not provide equal short-term flexibility. This deliberately abstract example requires no assumption about an actual storage site’s engineering.
The same principle applies to geography. Gas held far from the demand point still requires a viable delivery route. A national surplus should not be translated directly into a claim that every local market has ample immediate supply.
For readers in India and Pakistan, the U.S. underground-storage report should remain labeled as U.S. data. It does not measure local gas stocks, LNG cargo availability or domestic pipeline conditions. A connection to a local-market question needs additional evidence rather than a geographic shortcut.
Build a research record that survives revisions
Save the original report version, the forecast recorded before publication and the values used for historical comparisons. When revised data become available, retain both the originally observed number and the later estimate if you are evaluating an earlier market interpretation.
Missing data deserve a separate label. A blank regional observation does not prove zero stocks or zero change. CrowdSent’s guide to missing market data versus zero explains how an innocent-looking substitution can distort a chart or calculation.
When a commentary attributes a price move to storage, first verify the source and timing of the claim. Then preserve the observation and alternative explanations in a research journal. Storage evidence can support a conditional explanation without becoming a promise about the next price move.
Frequently asked questions
1. What does Bcf mean in a storage report?
Bcf means billion cubic feet, a unit of volume. Check whether the number is a stock level or a change over a period. A weekly Bcf change cannot be compared directly with a daily flow without accounting for the time interval.
2. Is working gas the same as total gas in storage?
No. Working gas and base gas are distinct categories. The weekly working-gas measure does not simply add every stored molecule into one immediately usable quantity. Read the category definition before comparing it with a total-inventory series.
3. Does a positive storage change mean demand fell?
Not by itself. Storage changes reflect the balance of supply and use, and sometimes non-flow adjustments. A build can occur under different combinations of production, imports, exports and consumption. Identify the contributing evidence before assigning a cause.
4. How can an injection be smaller than expected but stocks remain high?
The surprise concerns this interval’s change relative to a forecast. The stock level includes the accumulation from earlier periods. A modest build can leave a large pre-existing surplus intact, so both observations can be true.
5. Can stocks increase while the seasonal surplus shrinks?
Yes. If the seasonal reference increases faster than actual stocks, the gap narrows despite a build. Compare both series at both dates. Looking only at the new storage level hides what happened to the reference.
6. Why can the national total differ from a regional story?
The total combines regions whose changes may offset. A national build can coexist with a regional draw. Use the geography appropriate to the question and avoid treating an aggregate as a direct measurement of one delivery location.
7. Is capacity a guarantee of immediately available gas?
No. Capacity describes a storage limit under a stated definition. Current inventory and withdrawal capability are separate measures. To assess near-term availability, the amount stored and the rate at which it can be delivered both matter.
8. Why can working gas change without the same physical flow?
A reclassification between working and base gas changes the recorded category. Check the release notes and any implied-flow measure. An unexplained difference is a reason to investigate rather than silently relabel the full stock change as an injection.
9. Is the five-year average a forecast?
No. It summarizes a historical reference period using the publisher’s method. It helps put an observation in context but does not predict the next report. Changes in weather and the structure of the gas balance can make the present differ from that history.
10. Does a storage surprise guarantee a natural gas price reaction?
No. The market may weigh other information, including expectations about future conditions. Keep the actual release, saved forecast and observed price interval separate. A statistical surprise and a causal explanation of a price move are different claims.
Conclusion: read the balance and its boundaries
Natural gas storage is most informative when the level, change, seasonal reference and regional scope stay together. Capacity, deliverability and reclassification notes answer additional questions that a headline cannot resolve. That fuller reading supports better research without pretending that one weekly number determines the market.
This article is educational and is not investment advice.
Source documentation checked 11 October 2026. Educational explanation from the CrowdSent Blog Team. Numerical examples are hypothetical unless explicitly identified otherwise. This article does not provide investment recommendations.