

CrowdSent Blog Team · 10 October 2026 · Monetary data literacy
M2 money supply measures a defined stock of money and money-like balances. Understanding it starts with the assets included, the country’s statistical rules and the observation period. A rising M2 line alone cannot establish how much people spent, why prices changed or where a market will move next.
This guide explains the current United States definition, works through an original component calculation and compares the labels used in India and Pakistan. All worked numbers below are hypothetical. They illustrate measurement, not current economic conditions or investment recommendations.
What the US M2 money supply includes
The Federal Reserve’s September 2026 H.6 release defines M2 using M1, small-denomination time deposits and retail money market fund balances, with deductions for individual retirement account and Keogh balances at depository institutions and money market funds. Small time deposits are issued in amounts below $100,000.
Current M1 contains qualifying currency, demand deposits and other liquid deposits. The last category includes savings deposits and money market deposit accounts. Savings therefore already enter M2 through M1. Adding them again to current M1 would count them twice.
The institutional boundaries matter too. The currency component excludes cash in depository institutions’ vaults, and deposit definitions exclude specified institutional holders. A household balance sheet containing shares, a house and retirement investments cannot simply be added up and called its contribution to M2.
Think of the definition as instructions for assembling a statistic. Before using a downloaded component, check whether it is a gross amount or already net of exclusions. A familiar label does not tell you whether another deduction is still required.
A hypothetical component calculation
Suppose a fictional dataset follows the current US component structure. Every amount is in billions of fictional currency units, measured on the same basis:
- Qualifying currency: 200
- Demand deposits: 500
- Other liquid deposits, including savings: 1,100
- Small-denomination time deposits: 150
- Retail money market fund balances: 250
- Required IRA and Keogh balance deduction: 100
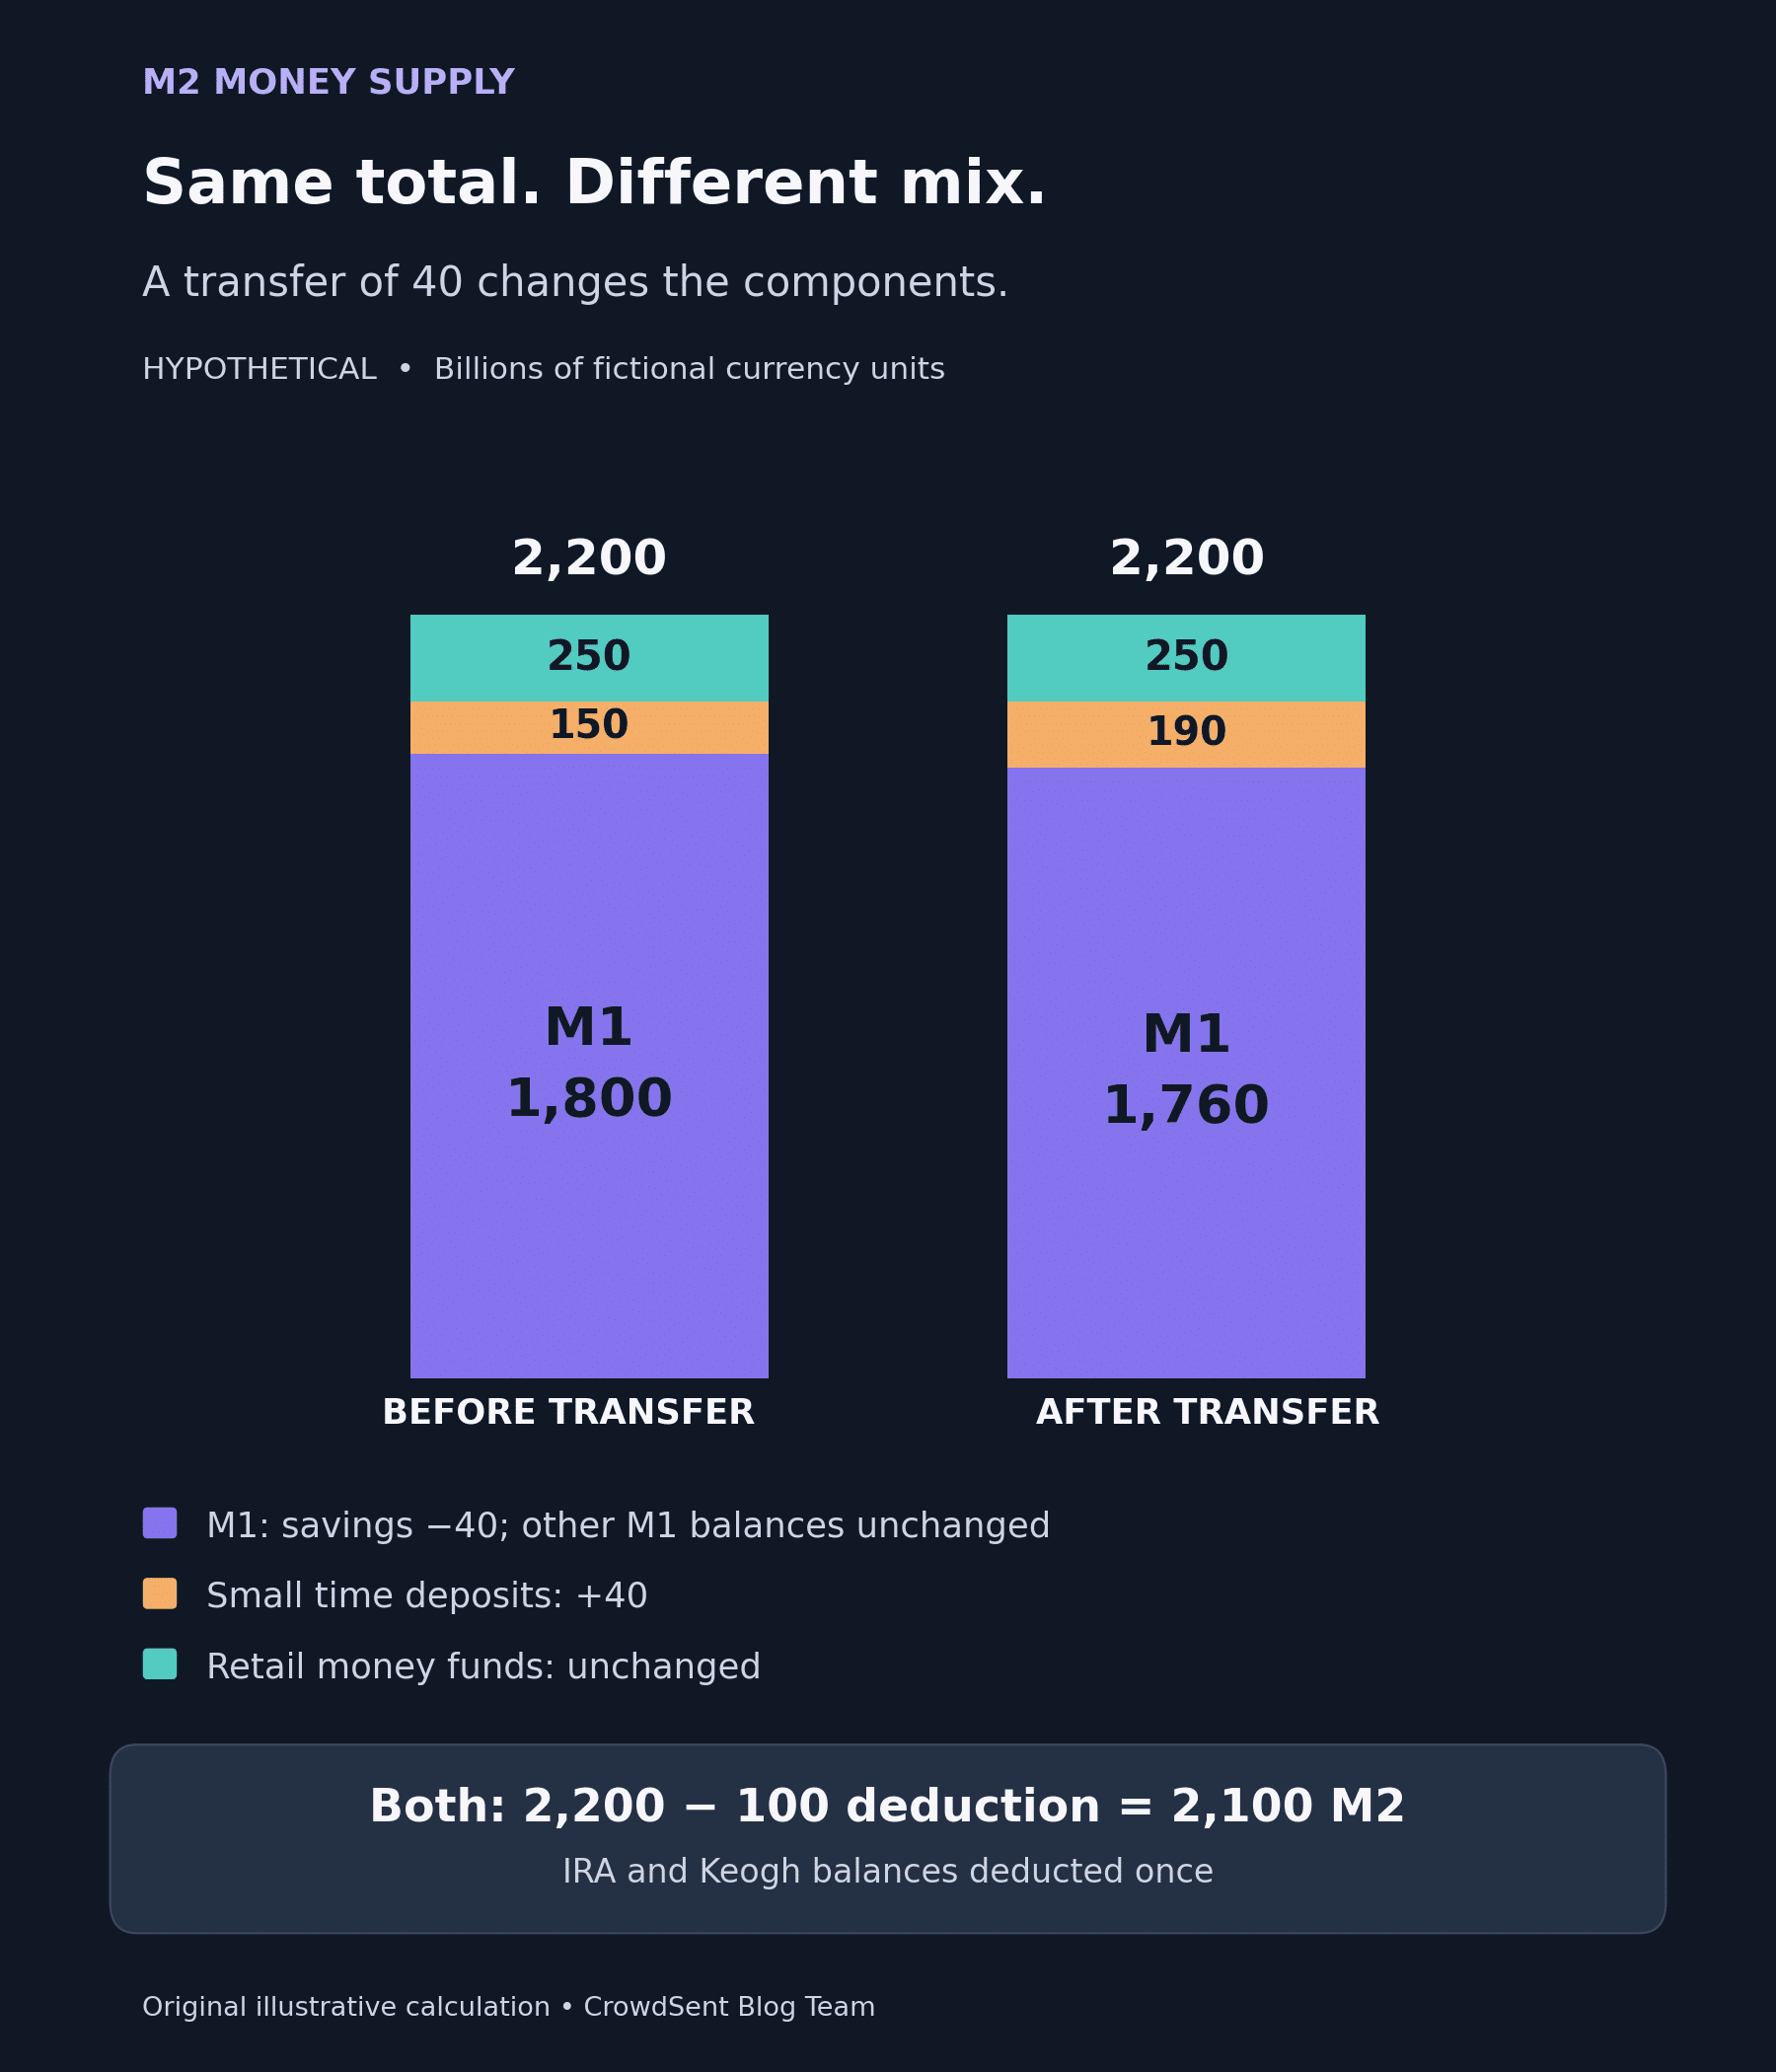
M1 is 200 + 500 + 1,100 = 1,800. M2 is 1,800 + 150 + 250 − 100 = 2,100. The deduction is shown separately because the invented inputs are gross component balances. Deducting it again from already-net inputs would understate the result.
Now imagine 40 moves from a qualifying savings account into a qualifying small time deposit, with all other entries unchanged. Other liquid deposits become 1,060 and small time deposits become 190. M1 falls to 1,760, while M2 remains 2,100. The composition changed without a change in the broader total.
This exercise gives a practical question for any chart: did the total change, or did money move between categories inside the total?
Why the May 2020 break matters
Older US explanations commonly list savings as an addition to M1 when calculating M2. That matched the earlier classification. Following the removal of the regulatory six-transfer limit on savings accounts, the Fed combined savings and other checkable deposits into “other liquid deposits” within M1.
The Fed’s technical explanation says the change was applied from the May 2020 observation and implemented in the February 2021 release. It created a break in M1 while leaving M2 unchanged by that reclassification.
Consequently, a sudden jump in the historical M1 line cannot all be interpreted as newly created balances. Equally, the classification change does not explain away actual movements in M2 during that period. Distinguish the transfer between statistical categories from changes in their combined value.
M2 and the monetary base measure different balances
The US monetary base combines currency in circulation with reserve balances held by depository institutions at the Federal Reserve. M2 includes qualifying public deposit balances and retail money fund holdings. A bank’s reserve account and its customer’s deposit account sit at different levels of the monetary system.
They also overlap through currency, so adding the base to M2 does not produce a meaningful unduplicated “total money” measure. The precise currency coverage differs: the base’s currency measure includes vault cash that the M1 currency component excludes.
The Bank of England’s account of money creation explains how bank lending creates a matching deposit. Capital, profitability, settlement needs and monetary policy constrain that process. Treating a reserve increase as an automatic, fixed multiple of new customer deposits leaves out those constraints.
Broad money also differs from liquidity in a particular order book. For that separate question, our guide to liquidity and trading volume explains depth, spreads and execution conditions.
Read the stock, change and growth rate separately
M2 is a stock: an amount outstanding. Depending on the series, an observation can be an end-period balance or an average of balances during the period. Payments, lending and spending over an interval are flows. A difference between two M2 observations does not measure the gross value of all payments made between them.
Consider three hypothetical, consistently measured monthly observations:
- Month A: 2,000 billion
- Month B: 2,100 billion
- Month C: 2,121 billion
From A to B, the stock rises by 100 billion, or 5%. From B to C, it rises by 21 billion, or 1%. Growth slowed, but the stock continued rising. A headline saying “money supply fell to 1%” would confuse an amount with its growth rate.
For a year-over-year calculation, compare the selected month with the same month a year earlier. For a monthly calculation, use the previous month. Retain the denominator: percentage growth equals the change divided by the earlier stock, multiplied by 100.
Keep seasonal adjustment and frequency consistent. FRED identifies M2SL as monthly, seasonally adjusted data in billions of dollars. A weekly unadjusted observation answers a different measurement question. Likewise, summing twelve monthly stocks creates a misleading annual “money created” total because balances are repeatedly counted.
The M2 label changes across countries
A shared abbreviation does not guarantee shared coverage. The US formula should not be pasted onto another central bank’s series.
India: the RBI’s monetary aggregate definitions distinguish traditional M2 from M3. M2 adds post-office savings-bank savings deposits to M1. M3 instead adds time deposits with the banking system to M1 and is commonly used as India’s broad-money measure. M1 itself includes currency with the public, banking-system demand deposits and other deposits with the RBI.
RBI also publishes definitions for new monetary aggregates labelled NM1, NM2 and NM3. The extra “N” matters: NM2 includes specified short-term resident time deposits. Record the exact series rather than treating M2 and NM2 as interchangeable names.
Pakistan: an official SBP weekly broad-money table assembles M2 from currency in circulation, other deposits with SBP and qualifying bank deposits, including residents’ foreign-currency deposits. Its bank-deposit footnote excludes interbank deposits, government deposits and foreign constituents.
The table separately presents an end-June stock and changes since July 1. Read the column heading before quoting a number. The cited archived table is used here to explain its structure, not to represent Pakistan’s latest observation. SBP’s weekly series and other monetary surveys may have different coverage and classification rules.
A cross-country comparison should therefore state the aggregate, currency, frequency, adjustment and reporting boundary for each country. Converting every value into US dollars changes the unit; it does not harmonize the definitions.
What M2 can contribute to an inflation discussion
M2 can help describe changes in monetary balances, alongside credit, output, prices and spending. The Federal Reserve’s money-supply overview treats monetary aggregates as one part of a wider set of economic information used in policy analysis.
For an illustrative economy, suppose nominal annual output is 3,000 and average money balances are 2,000. The output-to-money ratio is 1.5. If balances rise to 2,200 while nominal output remains 3,000, the ratio becomes about 1.364. The arithmetic accommodates higher balances without higher nominal output because the ratio changes.
This example is not an inflation model. It demonstrates why holding spending behavior fixed is an additional assumption. Explaining consumer prices also requires evidence about production, demand, supply constraints and the relevant time horizon. An M2 growth rate cannot simply be copied into an inflation forecast.
For a research note, preserve the source version, reference period, component explanation and alternative interpretations. Our market research journal template provides a place to keep that evidence separate from a proposed explanation.
Explore CrowdSent with this measurement check in mind: identify the monetary aggregate before interpreting its chart.
FAQs
1. Does M2 include every kind of money or wealth?
No. It covers the instruments and holders specified by the statistical definition. Property, equities and many other investments fall outside that boundary. Someone’s net wealth also subtracts liabilities, whereas M2 is not a household net-worth calculation. Use the aggregate’s coverage notes rather than a broad everyday meaning of “money.”
2. Are savings accounts included in US M2 twice?
They should be counted once. Under the current framework, savings are within other liquid deposits in M1, which then feeds into M2. Combining an old formula that adds savings separately with current M1 data introduces double counting. Match the formula to the date and definition of the inputs.
3. Does moving money between two banks increase M2?
A transfer between equally eligible deposit accounts generally changes where the balance is recorded rather than the aggregate amount. The answer can differ when eligibility, holder classification or instrument type changes. In a worked example, specify those boundaries before deciding whether the transfer stays inside the same aggregate.
4. Is an M2 increase the same as central-bank money printing?
The phrase hides several mechanisms. M2 includes bank deposits, and new bank lending can create deposits without newly printed banknotes. Central-bank operations affect reserve balances and can affect wider money through particular transactions. Identifying the mechanism requires the relevant balance sheets and counterparties, not just the direction of the M2 line.
5. Can M2 growth slow while M2 reaches a new high?
Yes. In the hypothetical sequence above, the stock rises from 2,100 to 2,121 even though monthly growth slows from 5% to 1%. The latest level is higher, while the pace of increase is lower. State whether your claim concerns the level, its change or its percentage growth.
6. Should monthly M2 observations be added to get an annual total?
No. Stocks recur across observations, so adding monthly balances repeatedly counts money that remains outstanding. An annual analysis might use an annual average, an end-year stock or growth between matching dates. Choose the construction that fits the question and label it explicitly instead of calling the sum annual money supply.
7. Why can two M2 charts show different values?
Check country, series identifier, units, seasonal adjustment, frequency and data vintage. One chart may use revised monthly averages while another retains earlier weekly observations. Also inspect transformations such as growth rates or currency conversion. Compare the underlying labels and values before deciding that one chart contains an error.
8. Is India’s M2 equivalent to US M2?
No. Their definitions add different assets to their respective M1 measures. India’s traditional M2 incorporates post-office savings deposits, while the US definition adds qualifying time deposits and retail money funds with specified deductions. For Indian broad-money analysis, verify whether the intended series is M3, NM3 or another named measure.
9. What should I check first in a Pakistan M2 release?
Read whether the figure is a stock or a change since the fiscal-year starting point. Then check the reference date, units, provisional or revised status and table-specific coverage. An amount in a cumulative-change column cannot be compared directly with another release’s total outstanding stock.
10. Can M2 predict a specific asset’s next price move?
M2 alone supplies no complete price forecast. A proposed relationship needs a specified horizon, economically plausible explanation and testing that respects publication dates and revisions. A chart overlay can suggest a research question, but it does not establish causality or a reliable trading rule.