

By CrowdSent Blog Team
The interest coverage ratio compares earnings before interest and taxes with interest expense for the same period. It describes how many times the defined earnings amount covers that interest charge. It does not count the cash in a bank account or calculate how quickly the borrowing principal can be repaid.
For a company reader, the useful work starts before division: identify the earnings definition, locate the interest line, and keep the reporting periods aligned. The fictional example below follows those choices through a simple calculation and two separate stress scenarios.
Interest coverage ratio: state the formula first
This guide uses interest coverage = EBIT ÷ interest expense. A result of 3.0 times means three units of EBIT for each unit of interest expense in that period. It does not mean three years of future interest payments are already funded.
Federal Reserve research uses this EBIT-based definition and finds that meaningful distress thresholds vary across firms and industries. That is a reason to avoid presenting one numerical cutoff as a universal certificate of safety.
Interest coverage belongs beside, rather than in place of, balance-sheet leverage ratios. Leverage describes selected obligations relative to assets or equity at a date. Coverage compares two amounts measured over a period.
Build a transparent earnings bridge
Suppose fictional equipment maker Rowan reports annual net income of USD 45 million, income tax expense of USD 15 million and interest expense of USD 20 million. Assume no interest income or other complicating financing adjustments. Under this example’s stated EBIT convention, EBIT is 45 + 15 + 20 = USD 80 million.
The interest coverage ratio is 80 ÷ 20 = 4.0 times. Both inputs cover the same financial year, reporting group and currency scale. The calculation would be wrong if the USD 80 million annual EBIT were divided by a single quarter’s USD 5 million interest charge and presented as annual coverage of 16 times.
Do not automatically substitute a line labelled operating profit. SEC staff guidance explains that EBIT and EBITDA performance measures are reconciled to net income, and that operating income is not necessarily the directly comparable measure. Non-operating items can make the two earnings subtotals differ.
For an unfamiliar report, copy the reconciliation rather than reconstructing it from a headline. If a company presents adjusted EBIT, list the adjustments and retain that label. An exclusion for a restructuring charge changes the numerator even when interest expense remains unchanged.
Separate changes in earnings from changes in interest
Begin again with Rowan’s USD 80 million EBIT and USD 20 million interest expense. In scenario A, EBIT falls by 25% to USD 60 million, while interest remains USD 20 million. Coverage falls to 3.0 times. In separate scenario B, EBIT stays at USD 80 million while interest rises to USD 25 million. Coverage becomes 3.2 times.
| Scenario | EBIT | Interest expense | Coverage |
|---|---|---|---|
| Starting case | 80 | 20 | 4.0× |
| A: lower earnings | 60 | 20 | 3.0× |
| B: higher interest | 80 | 25 | 3.2× |
| C: both changes | 60 | 25 | 2.4× |
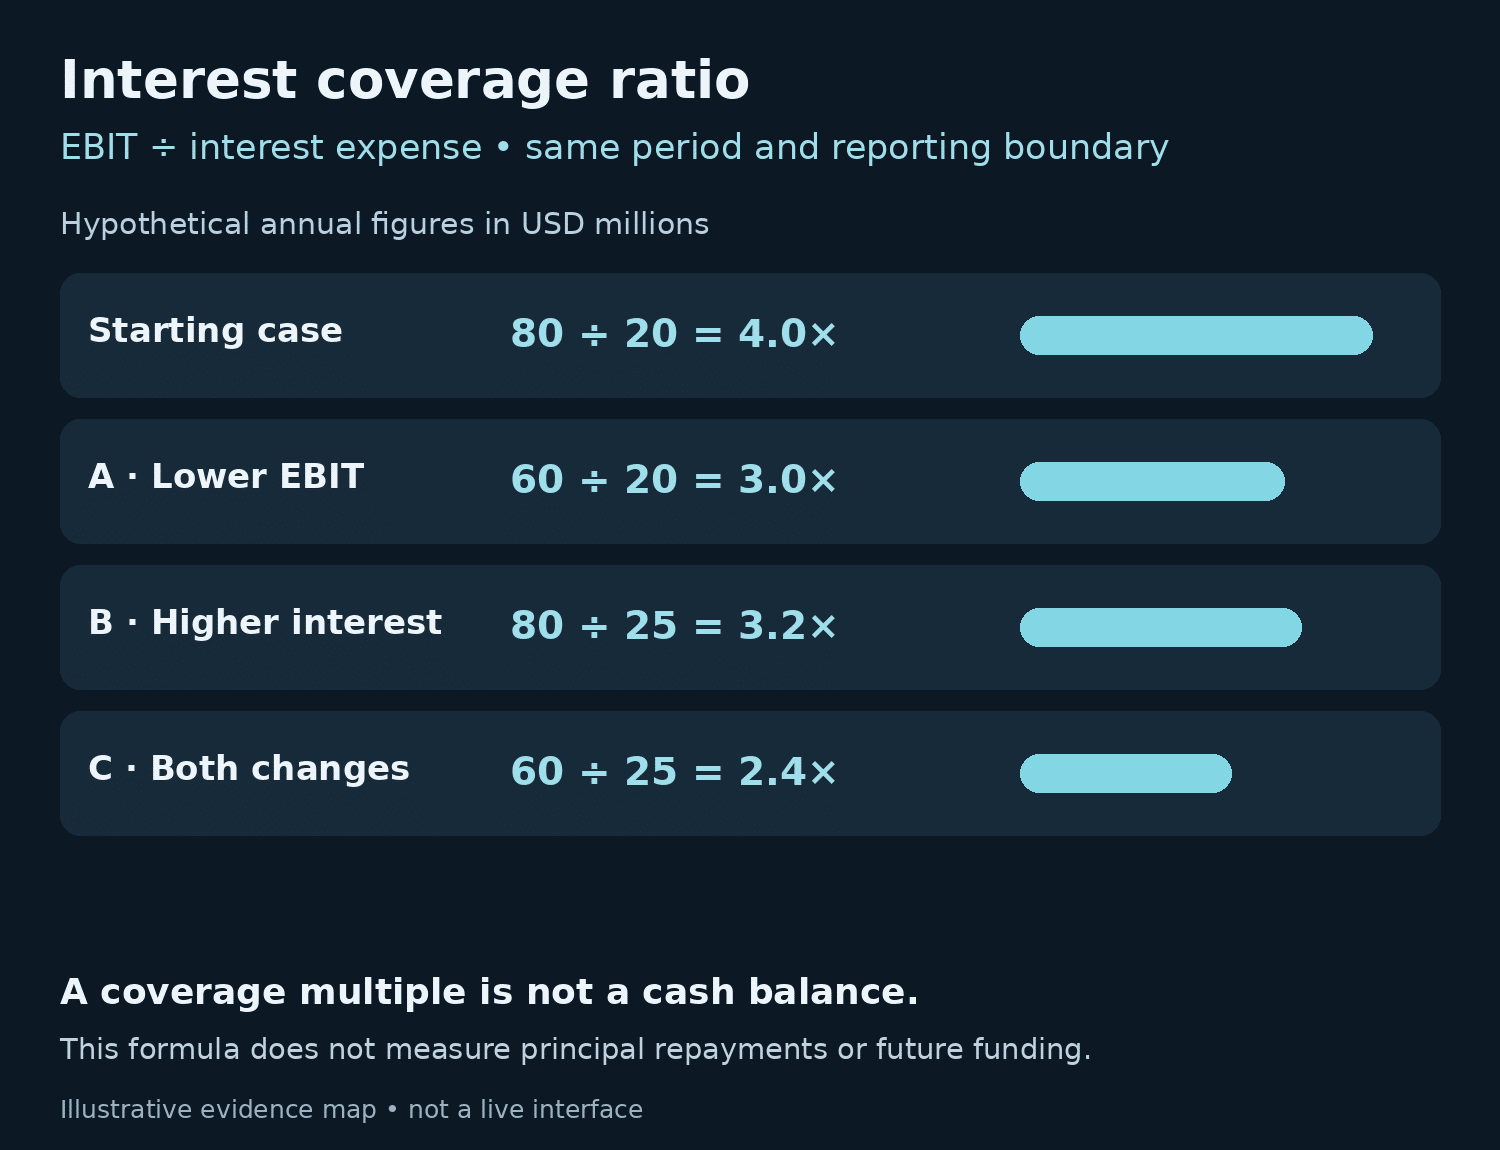
Scenario C combines the two changes: 60 ÷ 25 = 2.4 times. The table is a sensitivity exercise, not a forecast. It shows why explaining a declining ratio requires inspecting both inputs rather than assuming the company borrowed more.
A borrowing-rate change also needs a timing assumption. Existing fixed-rate debt may not reprice immediately, while floating-rate borrowing may reset under its contract. Read the debt notes before converting a market-rate headline into an assumed annual interest increase.
Keep accounting coverage separate from cash availability
EBIT is an earnings measure. A company can record sales before collecting the associated customer balances. Equipment spending, taxes and loan principal repayments can also create cash demands that the simple coverage calculation does not subtract. The connected financial-statements guide explains why profit and cash movement differ.
HMRC’s explanation of interest cover distinguishes servicing interest from repaying principal. Rowan’s 4.0 times ratio could therefore coexist with a large loan maturity next month. The ratio alone supplies neither the maturity date nor the funding source.
Read cash flow, accessible cash balances and the maturity schedule separately. This does not invalidate EBIT coverage; it keeps the question narrow enough for the answer to be meaningful. A complete payment timetable cannot be recovered from one earnings multiple.
Handle unusual denominators and adjusted measures
If EBIT is USD 10 million and interest expense is USD 20 million, coverage is 0.5 times: the specified earnings amount is smaller than the interest charge. That observation does not, by itself, establish that a payment was missed. Available cash or financing may affect the actual payment outcome.
With zero interest expense, division is undefined. Report the zero expense explicitly instead of inventing a very high ratio. With negative EBIT and positive interest, a negative result describes a loss-based numerator; it is not a useful conventional “times covered” amount.
Some presentations use EBITDA, cash interest, net interest or lender-defined adjustments. Record which version you have. Subtracting interest income from expense can make a denominator much smaller, so a net-interest ratio should not silently replace a gross-expense comparison.
Combine coverage ratios by adding amounts, not averaging multiples
Suppose two unrelated fictional manufacturers report comparable annual results. Ash has EBIT of USD 60 million and interest expense of USD 10 million, giving coverage of 6 times. Birch has EBIT of USD 30 million and interest expense of USD 30 million, giving coverage of 1 time. Assume identical accounting definitions and no transactions between the businesses.
The simple average of their ratios is 3.5 times: (6 + 1) ÷ 2. But their combined EBIT is USD 90 million and combined interest expense is USD 40 million. Coverage calculated from those totals is 2.25 times, not 3.5. Giving each company’s multiple equal weight overlooks their different interest amounts.
The same answer can be expressed as an interest-expense-weighted average. Ash accounts for 10 ÷ 40, or 25%, of combined interest; Birch accounts for 75%. Weighting their coverage multiples produces (25% × 6) + (75% × 1) = 2.25. This identity follows directly from the formula when the included interest amounts are positive and comparable.
The Federal Reserve’s aggregation method likewise divides a group’s aggregate EBIT by its aggregate interest expense. The resulting statistic answers a group-level question. It does not describe the typical company or imply that Ash’s resources are available to pay Birch’s creditors.
Preserve the weak component beside the combined result
Now assume Birch’s EBIT falls to negative USD 10 million while both interest charges stay unchanged. Combined EBIT becomes USD 50 million, so combined coverage is 50 ÷ 40 = 1.25 times. Ash still reports 6 times, while Birch has a negative earnings numerator.
A positive combined multiple therefore can coexist with an operating loss at one constituent. Keep the component amounts visible if your question concerns individual companies. Combining companies in a research spreadsheet does not create a legal group, a guarantee or a shared payment account. For actual consolidated statements, begin with the reported consolidated figures and investigate material intercompany eliminations rather than blindly adding subsidiary disclosures.
Reconcile rolling periods before comparing coverage
Coverage over a trailing twelve-month period can also be assembled from amounts. Imagine Cedar reports prior full-year EBIT of USD 100 million and interest expense of USD 20 million. The first six months of that year contributed EBIT of USD 30 million and interest of USD 8 million. The first six months of the new year contribute EBIT of USD 50 million and interest of USD 12 million.
To construct the twelve months ending at the new half-year date, remove the old first half and add the new first half. EBIT is 100 − 30 + 50 = USD 120 million. Interest expense is 20 − 8 + 12 = USD 24 million. Trailing coverage is therefore 120 ÷ 24 = 5 times.
The new half-year ratio alone is 50 ÷ 12, or about 4.17 times. Neither number is an arithmetic mistake: the windows differ. Doubling both half-year amounts would leave that shorter-window ratio at 4.17, rather than reconstructing the observed twelve-month result. Annualisation cannot supply the missing seasonal history.
Before using this bridge, check that the annual and interim figures share the same earnings definition, currency scale and reporting scope. Use restated comparatives when the new report replaces earlier figures. If a business was acquired during the window, distinguish reported consolidated results from any separately disclosed pro forma scenario; inserting a full year of acquired earnings without matching interest changes the question.
If only nine-month year-to-date results are available, the same subtraction-and-addition logic can construct a trailing window using matching nine-month comparatives. Do not add the latest quarter to nine-month results that already include it. First mark the actual start and end dates of every input so no month is counted twice.
A useful worksheet has separate columns for prior full year, removed interim period and added interim period, with EBIT and interest on separate rows. Retain the source report for each cell. Recalculate the multiple only after completing both bridges. That structure makes a missing period or mismatched definition visible before it turns into a persuasive-looking coverage number.
A short reproducibility checklist
- Record the annual or interim period, currency scale and reporting group.
- Show the EBIT source or reconciliation and identify adjustments.
- State whether interest is gross expense, net expense or a contractual measure.
- Retain the two original amounts alongside the calculated multiple.
- Compare consistent definitions over time, then inspect cash flows and maturities separately.
A debt agreement can specify its own calculation and testing dates. An educational formula does not establish covenant compliance. Where the agreement uses adjusted earnings or special exclusions, preserve those requirements rather than replacing them with a more familiar ratio.
Frequently asked questions
Is interest coverage the same as times interest earned?
The labels commonly refer to an EBIT-based coverage measure. Still check the formula: a provider or agreement may use a different earnings definition or interest amount.
Why add interest back to net income?
Net income already reflects interest expense. In the simplified Rowan bridge, adding interest and income tax back reconstructs the specified pre-interest, pretax earnings amount before comparing it with interest.
Does 4 times mean four years of payments are funded?
No. Rowan’s annual earnings are four times that year’s interest expense. The ratio does not show accumulated cash or establish what future earnings and borrowing costs will be.
Can coverage fall without new borrowing?
Yes. Lower EBIT can reduce it with interest unchanged. Existing floating-rate borrowing can also become more expensive without an increase in the amount borrowed.
Is a higher result always better?
It represents more defined earnings per unit of interest, holding definitions constant. It does not by itself establish earnings quality, cash availability, suitable leverage or an attractive share price.
Can I use one quarter of data?
Yes, if both earnings and interest cover that quarter and you label the period. Seasonal results may make comparisons with a full-year ratio misleading.
How does EBITDA coverage differ?
It adds depreciation and amortization back to the earnings numerator, unlike EBIT coverage. With positive add-backs and the same positive interest expense, it produces a higher result.
What happens when interest expense is zero?
The ratio is undefined. Describe the absence of expense in the selected period and investigate relevant borrowing disclosures rather than reporting an arbitrary number.
Does the ratio include repayment of principal?
No. This formula includes interest expense, not scheduled principal repayments. A maturity schedule and other measures answer the separate repayment question.
Where should I check an unexplained change?
Start with the earnings reconciliation and interest or borrowing notes. Check reporting-period changes, acquisitions, adjustment definitions and units before attributing the movement to operations.
Educational note: All companies and worked figures are fictional. This article explains financial reporting, not investment recommendations. A ratio or accounting comparison cannot predict a share price or guarantee a financial outcome.
Continue exploring company-reporting concepts with CrowdSent and its current membership information. Keep original company filings alongside your research notes.