

Debt-to-equity vs debt-to-assets compares an obligation amount with two different balance-sheet bases. The first scales it against shareholders’ equity; the second scales it against total assets. Before comparing either ratio, check what the numerator calls debt.
Some calculations include only interest-bearing borrowing. Others use all liabilities, including amounts owed to suppliers and other non-borrowing obligations. Two published numbers with the same label can therefore describe different calculations even when their reporting dates match.
Debt-to-Equity vs Debt-to-Assets: write down the debt convention first
The CFA Institute financial ratio list uses interest-bearing short-term and long-term debt, excluding items such as accounts payable. By contrast, BDC’s financial-ratio guide presents debt-to-equity and debt-to-assets using total liabilities. The lesson is to inspect the formula, not assume every source follows one convention.
The IFRS Foundation’s financing-liabilities discussion also notes that IFRS Standards do not define debt. Company disclosures and analytical definitions therefore matter. Keep gross borrowing, net debt and total liabilities distinct unless a specific calculation explicitly reconciles them.
In the debt-to-equity vs debt-to-assets example, debt means interest-bearing borrowing. Other liabilities are shown separately. Equity means reported book equity at the same date, rather than market capitalization.
Calculate both ratios from the same amounts
Assume ExampleCo reports $1,000 million of assets, $300 million of interest-bearing debt, $300 million of other liabilities and $400 million of equity. The balance sheet reconciles: $300 million plus $300 million plus $400 million equals $1,000 million.
Debt-to-equity is $300 million divided by $400 million, or 0.75. That means 75 cents of the specified debt per dollar of book equity. Debt-to-assets is $300 million divided by $1,000 million, or 30%.
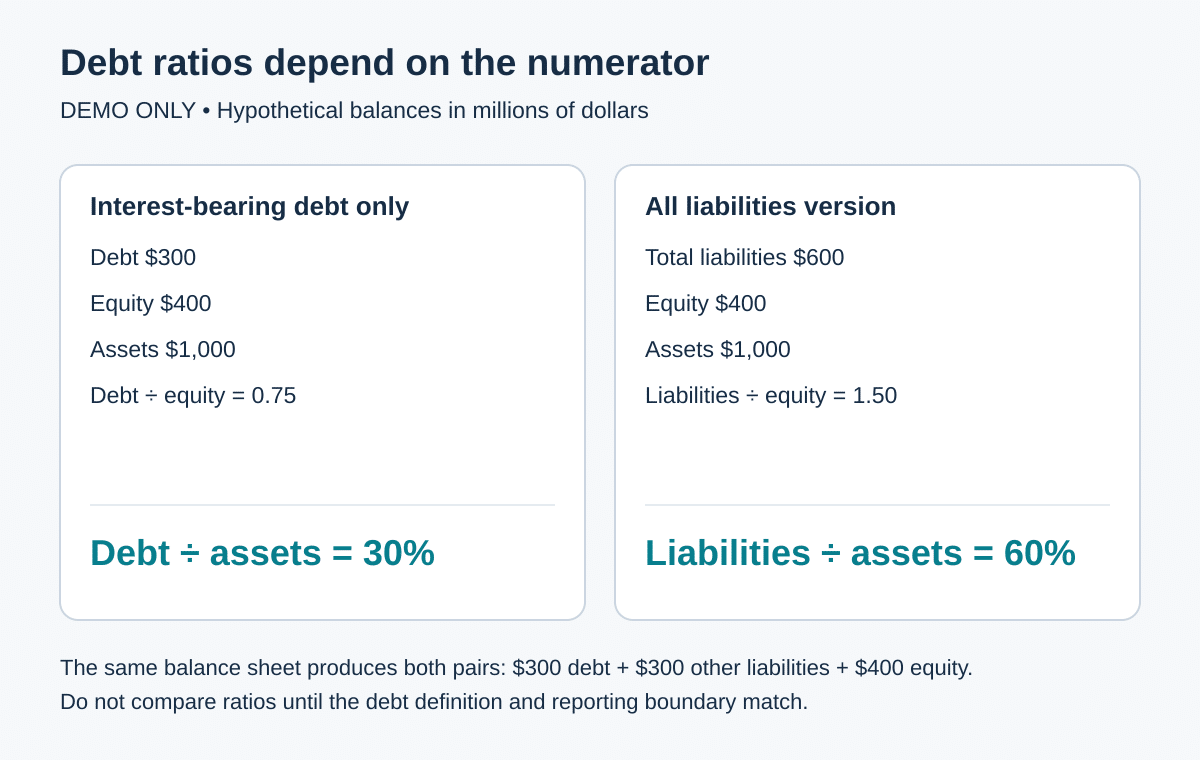
Under the all-liabilities convention, the numerator becomes $600 million. Liabilities-to-equity is 1.50 and liabilities-to-assets is 60%. Neither pair results from a change in the company. The numerator changed, so an analysis should label the versions explicitly.
Avoid an incomplete shortcut between ratios
A familiar conversion says debt-to-assets equals debt-to-equity divided by one plus debt-to-equity. That shortcut assumes the amount labeled debt and equity together account for all assets. It works for a total-liabilities numerator under the ordinary assets-equals-liabilities-plus-equity relationship.
In this example, 1.50 divided by 2.50 equals 60%, matching total liabilities divided by assets. But applying the same shortcut to interest-bearing debt gives 0.75 divided by 1.75, or about 42.86%, which is not the actual 30% debt-to-assets figure.
The missing amount is other liabilities. Their ratio to equity is $300 million divided by $400 million, also 0.75. Including them gives 0.75 divided by the sum of 1, 0.75 and 0.75, which equals 30%. Keeping the full balance-sheet equation visible prevents a plausible-looking wrong answer.
Trace a repayment through both denominators
Suppose ExampleCo repays $100 million of debt using cash already included in assets. Debt falls to $200 million and assets fall to $900 million. Equity remains $400 million, assuming no fee, gain, loss or other simultaneous transaction.
Debt-to-equity becomes 0.50, while debt-to-assets becomes approximately 22.22%. Both decline, but the asset denominator shrinks alongside the debt. Merely reducing the original 30% by ten percentage points would miss that denominator change.
In a separate scenario from the initial balances, suppose a $100 million asset write-down reduces assets and equity equally, with taxes ignored. Assets become $900 million, equity becomes $300 million and debt stays $300 million. Debt-to-equity rises to 1.00 and debt-to-assets to approximately 33.33%, despite no new borrowing.
Read payment capacity beside balance-sheet leverage
Neither ratio supplies the interest rate, maturity timetable or expected cash available for repayment. A fixed-rate loan due in several years and a floating-rate facility approaching maturity can create different demands despite identical balances.
BDC’s debt-to-equity explanation emphasizes that the measure uses balance-sheet amounts and does not show the cash the business generates. Pairing the ratios with cash-flow information and debt disclosures gives a fuller explanation of what must be paid and when.
Lease obligations, guarantees and covenant adjustments may require separate review. Record the treatment used, rather than quietly mixing a lender’s adjusted debt figure with an unadjusted balance sheet. A contractual ratio must follow the contract’s definitions.
For debt-to-equity vs debt-to-assets comparisons, match reporting boundaries and business models. Financial institutions and nonfinancial operating companies can have very different funding structures. A ratio is a reproducible description of selected balances, not a universal safety threshold or a forecast of share-price performance.
Debt-to-equity vs debt-to-assets: common questions
1. Is debt always the same as total liabilities?
No. An interest-bearing definition excludes some liabilities, while an all-liabilities definition includes them. The article calculates both so the difference is visible.
2. Does debt-to-equity use market capitalization?
The examples use book equity from the balance sheet. A market-value leverage measure has a different denominator and should be identified separately.
3. Can the same business have 30% and 60% debt-to-assets?
Yes, under the two stated numerator conventions. The example has $300 million borrowing and $600 million total liabilities against $1,000 million assets.
4. When does the simple conversion between ratios work?
It works when the numerator plus equity accounts for the asset total. If interest-bearing debt omits other liabilities, those omitted amounts must also enter the reconciliation.
5. Why does repaying debt also change the asset denominator?
A repayment using existing cash reduces both debt and cash. Because cash is an asset, the total asset base declines at the same time.
6. Can leverage rise without additional borrowing?
Yes. An asset write-down can reduce equity and assets while debt remains unchanged. The resulting ratios rise because their denominators shrink.
7. What if reported equity is negative?
A negative debt-to-equity result does not indicate negative borrowing or low risk. The usual ratio interpretation breaks down, so explain the underlying balance sheet instead.
8. Should cash be deducted from debt automatically?
No. That creates a net-debt measure. Its treatment of cash, cash equivalents and restrictions must be stated and should not silently replace gross debt.
9. Do the ratios reveal debt maturity risk?
No. They contain amounts, not repayment dates. Review current portions, maturity schedules, refinancing terms and relevant cash-flow information separately.
10. What should accompany a leverage comparison?
Retain the debt definition, reporting date, currency, consolidated boundary, asset and equity amounts, lease treatment and material adjustments. These details explain otherwise misleading differences.
Educational note: This article explains financial-statement analysis, not investment advice. All company figures are hypothetical. Ratios and cash-flow measures do not predict share prices or guarantee financial outcomes.
Explore CrowdSent membership.
Keep the source date, units, reporting boundary and calculations together in a market research journal so later comparisons can be reproduced.